Fig. 12
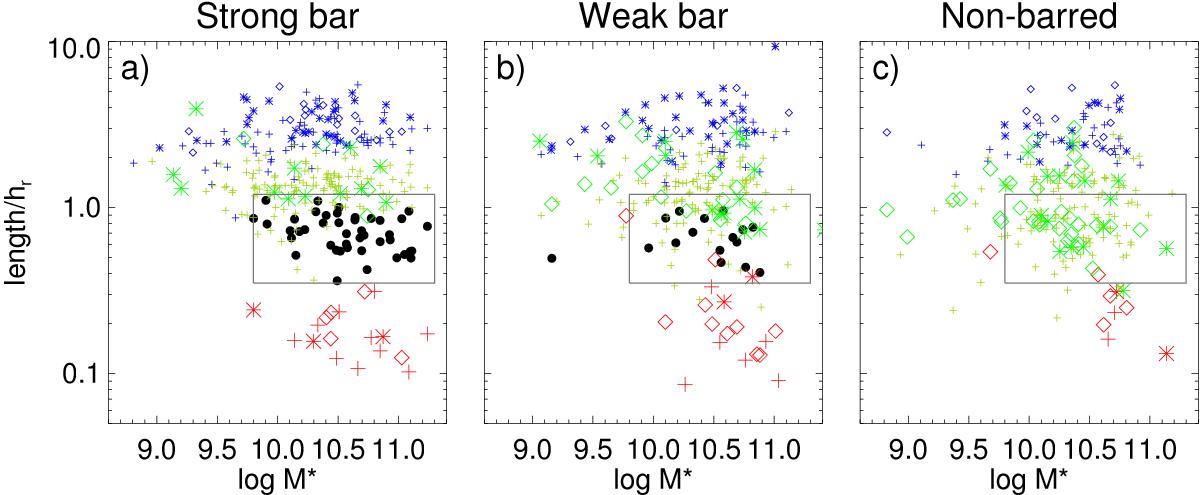
Same as in Fig. 11 (with the same symbols), but now the normalization is to the scalelength of the disk, hr, taken from P4 (Salo et al. 2015). The three panels show the S4G galaxies in different bins of the bar family so that bar strength decreases from a) to c). The box in all panels shows the region that covers the barlenses in the barred galaxies.
Current usage metrics show cumulative count of Article Views (full-text article views including HTML views, PDF and ePub downloads, according to the available data) and Abstracts Views on Vision4Press platform.
Data correspond to usage on the plateform after 2015. The current usage metrics is available 48-96 hours after online publication and is updated daily on week days.
Initial download of the metrics may take a while.