Fig. 11
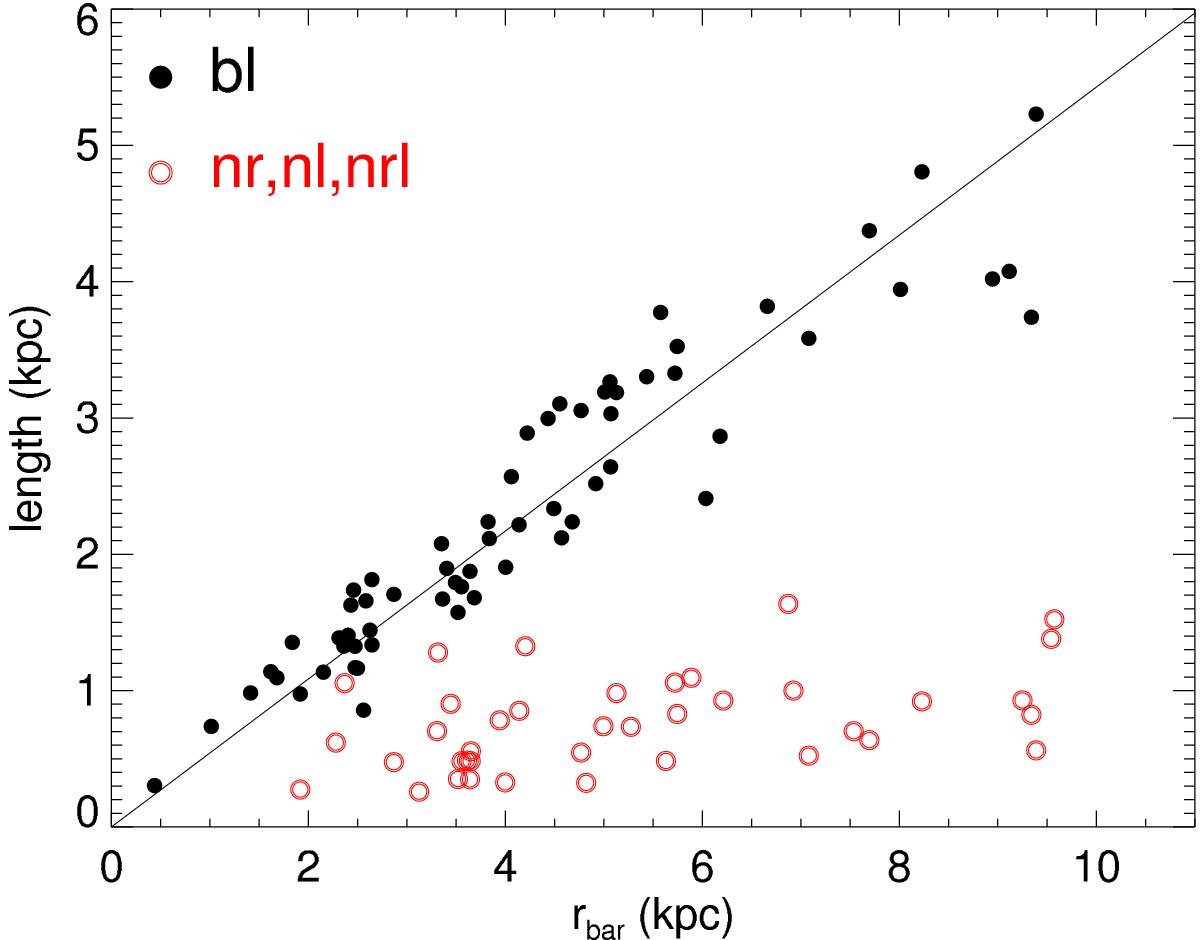
Measured sizes of barlenses plotted as a function of the measured barlength, both given in kiloparsecs. The line shows a linear fit between these two parameters (slope = 0.54 forcing y-intercept = 0). For comparison, the measured sizes of the nuclear features are also shown, with no correlation with the barlength. However, it is important to note that the small nuclear structures may fall below the resolution of S4G images (FWHM = 2.1′′).
Current usage metrics show cumulative count of Article Views (full-text article views including HTML views, PDF and ePub downloads, according to the available data) and Abstracts Views on Vision4Press platform.
Data correspond to usage on the plateform after 2015. The current usage metrics is available 48-96 hours after online publication and is updated daily on week days.
Initial download of the metrics may take a while.