Fig. 5
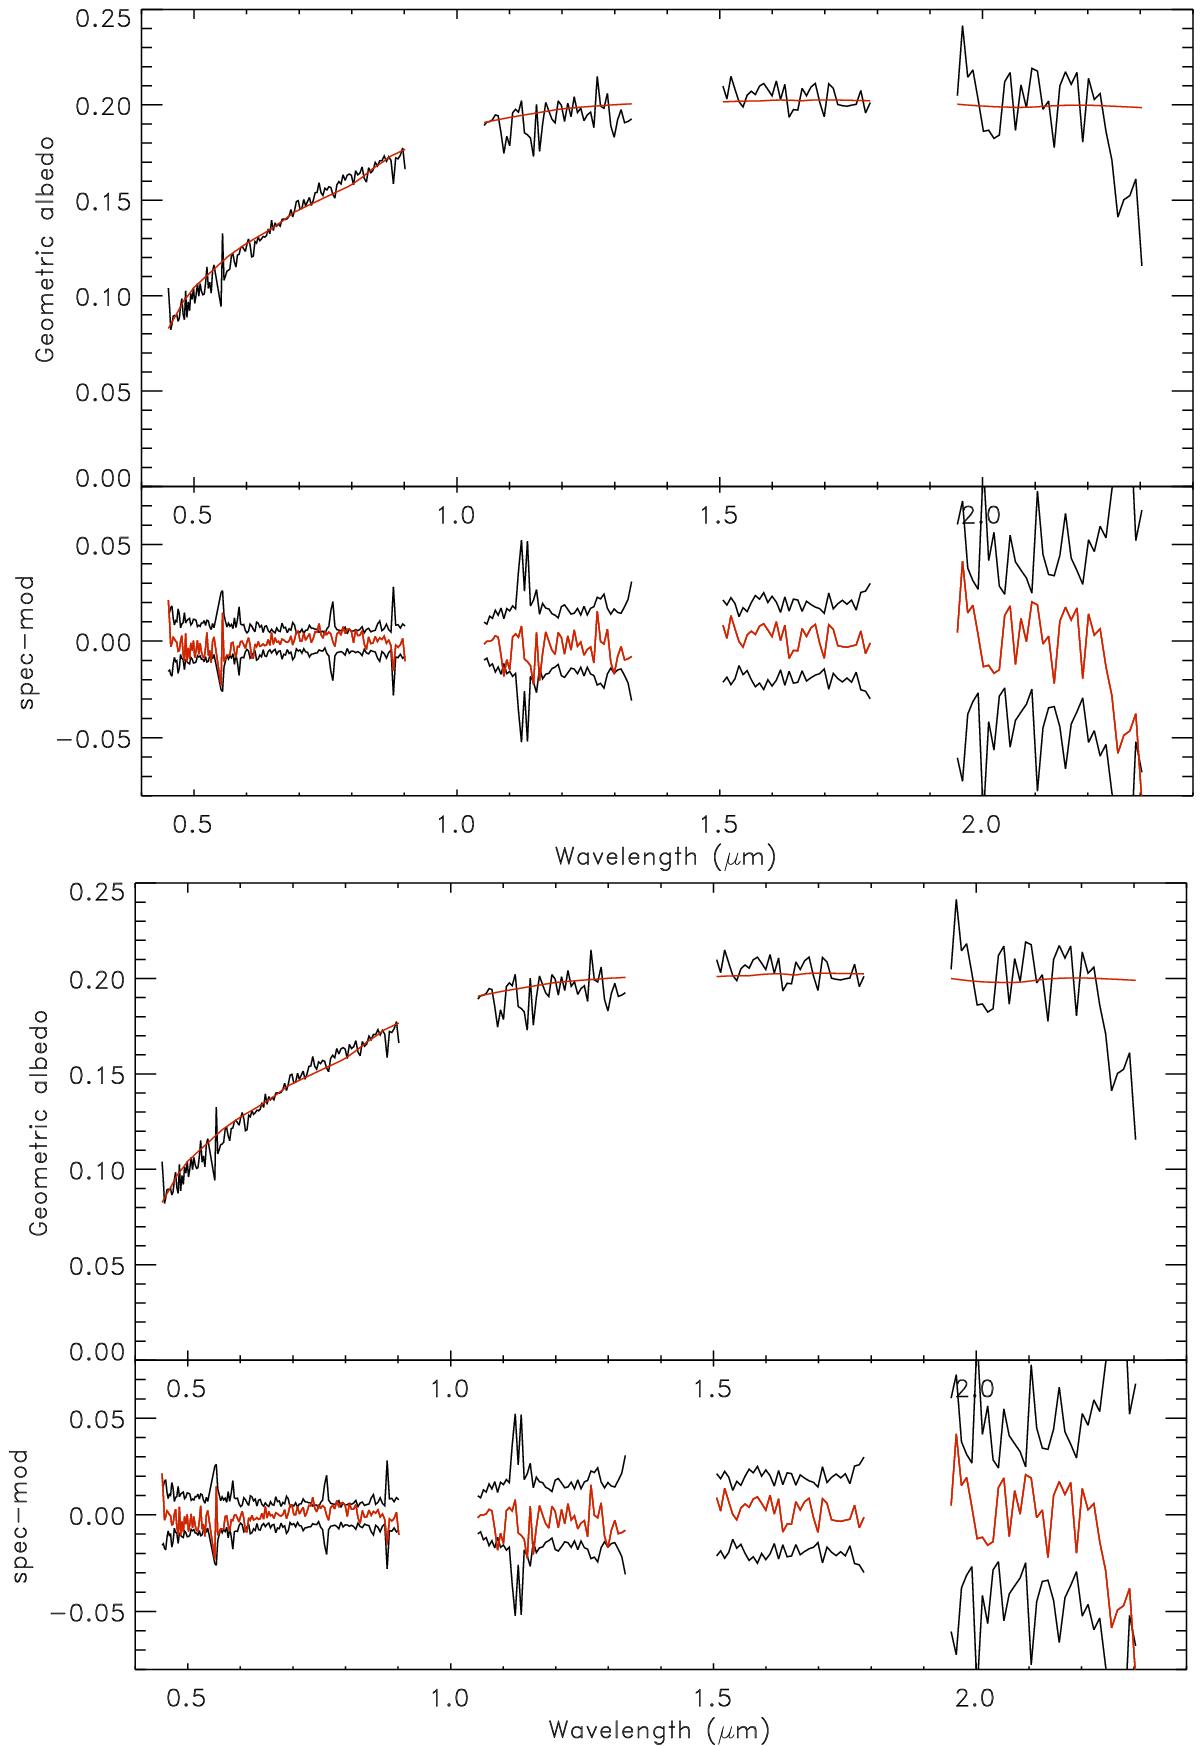
Model 1 (top) and model 2 (bottom) considering the presence of crystalline H2O with grain sizes of 5 and 10 μm, respectively (see Table 2 for details). In the upper part of each graphic, is plotted the observed spectrum (black) and the corresponding model (red), all normalized to 0.020 at 1.75 microns. In the bottom part is given the associated spectrum-model (red) and the noise (black) corresponding to the quadratic sum of the standard deviation of the data.

Current usage metrics show cumulative count of Article Views (full-text article views including HTML views, PDF and ePub downloads, according to the available data) and Abstracts Views on Vision4Press platform.
Data correspond to usage on the plateform after 2015. The current usage metrics is available 48-96 hours after online publication and is updated daily on week days.
Initial download of the metrics may take a while.