Free Access
Fig. 8
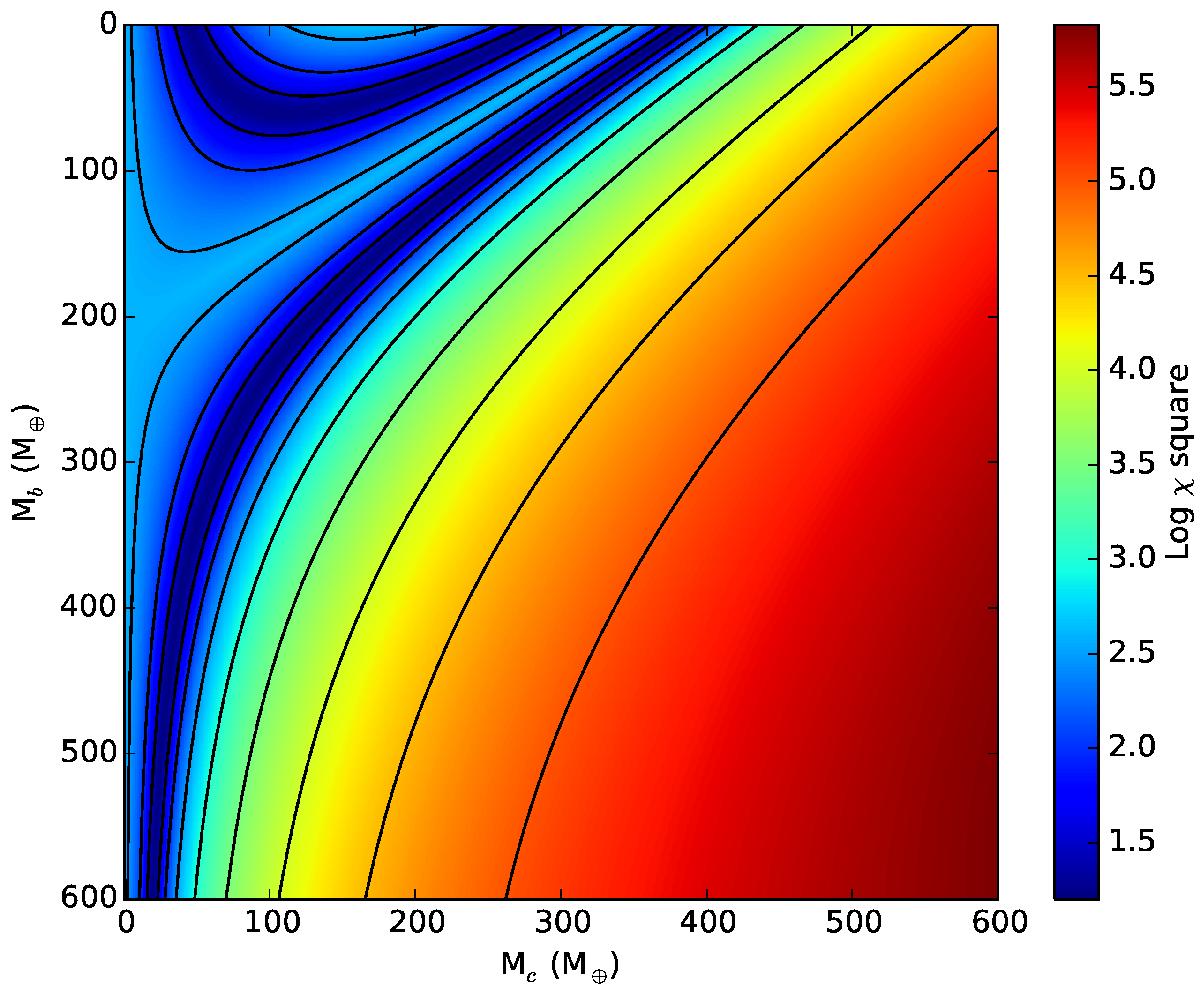
As Fig. 6, but showing the χ square surface for Re(Zfree) = 0.2, and φ = π/ 4 over the same mass range. A degeneracy can be seen between positive △ (top left) and negative △ (down and towards the right). Contour levels are shown at intervals of 0.5.
Current usage metrics show cumulative count of Article Views (full-text article views including HTML views, PDF and ePub downloads, according to the available data) and Abstracts Views on Vision4Press platform.
Data correspond to usage on the plateform after 2015. The current usage metrics is available 48-96 hours after online publication and is updated daily on week days.
Initial download of the metrics may take a while.