Free Access
Fig. 7
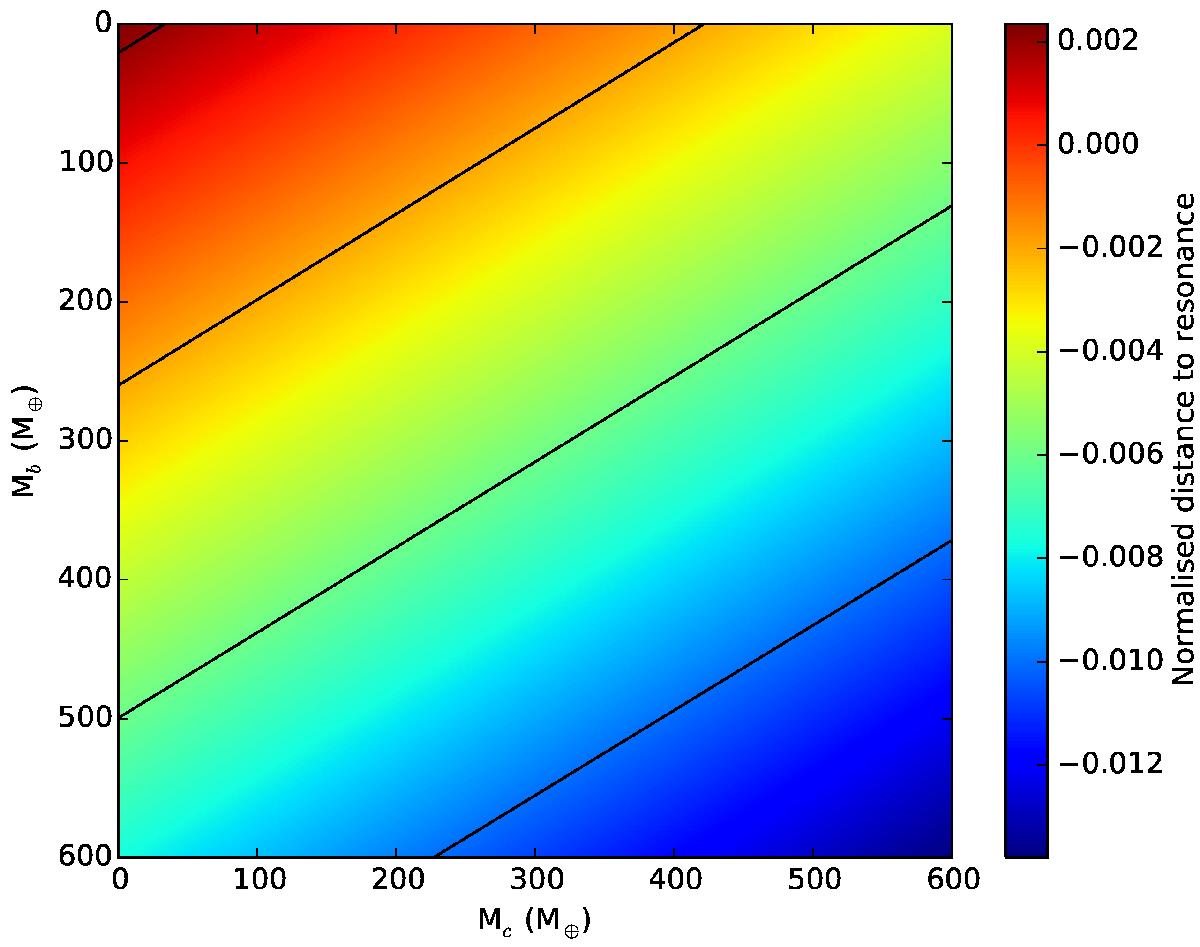
As Fig. 6, but showing the normalised distance to resonance △ over the same mass ranges. In this case it can be seen that △ becomes negative for all good fits, implying that the planets are in fact below the 3:2 resonance if this assumption held. Contour levels are shown at intervals of 0.004.
Current usage metrics show cumulative count of Article Views (full-text article views including HTML views, PDF and ePub downloads, according to the available data) and Abstracts Views on Vision4Press platform.
Data correspond to usage on the plateform after 2015. The current usage metrics is available 48-96 hours after online publication and is updated daily on week days.
Initial download of the metrics may take a while.