Fig. 5
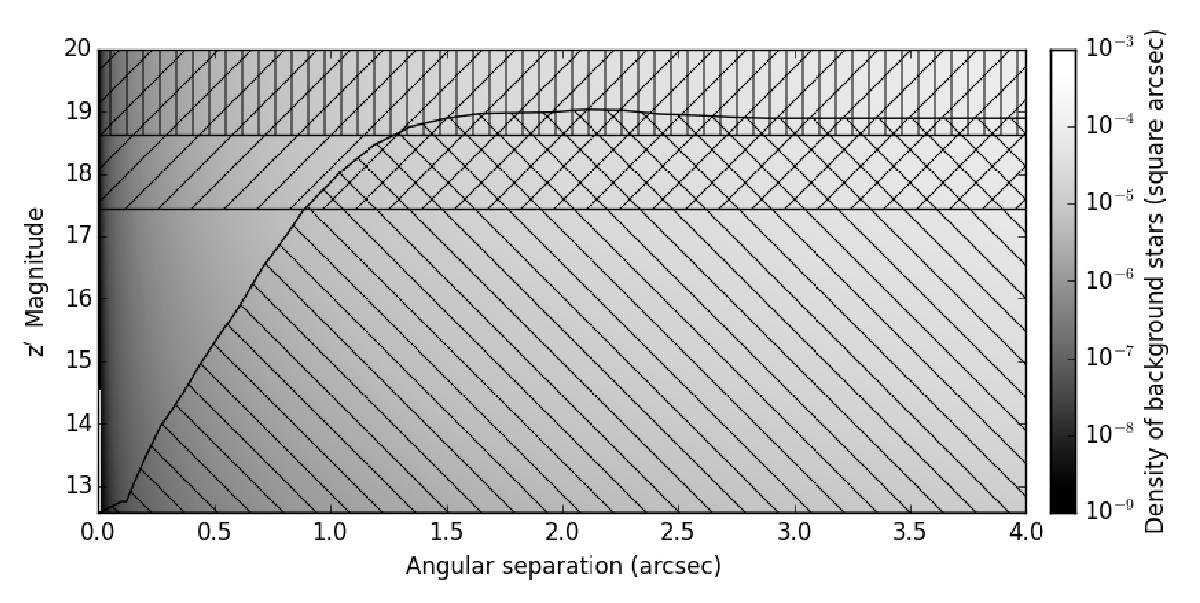
Map of the density of background stars chance-aligned with K2-19, integrated within an angular separation of up to 4′′, as a function of its magnitude in the z′-band. The negative-slope hatched region displays all the stars that would have been significantly detected in the AstraLux lucky-imaging data with more than 5σ. The negative-slope and vertical hatched regions display the stars that are too faint to reproduce the observed transit depth of K2-19b and c, respectively.
Current usage metrics show cumulative count of Article Views (full-text article views including HTML views, PDF and ePub downloads, according to the available data) and Abstracts Views on Vision4Press platform.
Data correspond to usage on the plateform after 2015. The current usage metrics is available 48-96 hours after online publication and is updated daily on week days.
Initial download of the metrics may take a while.