Fig. 2
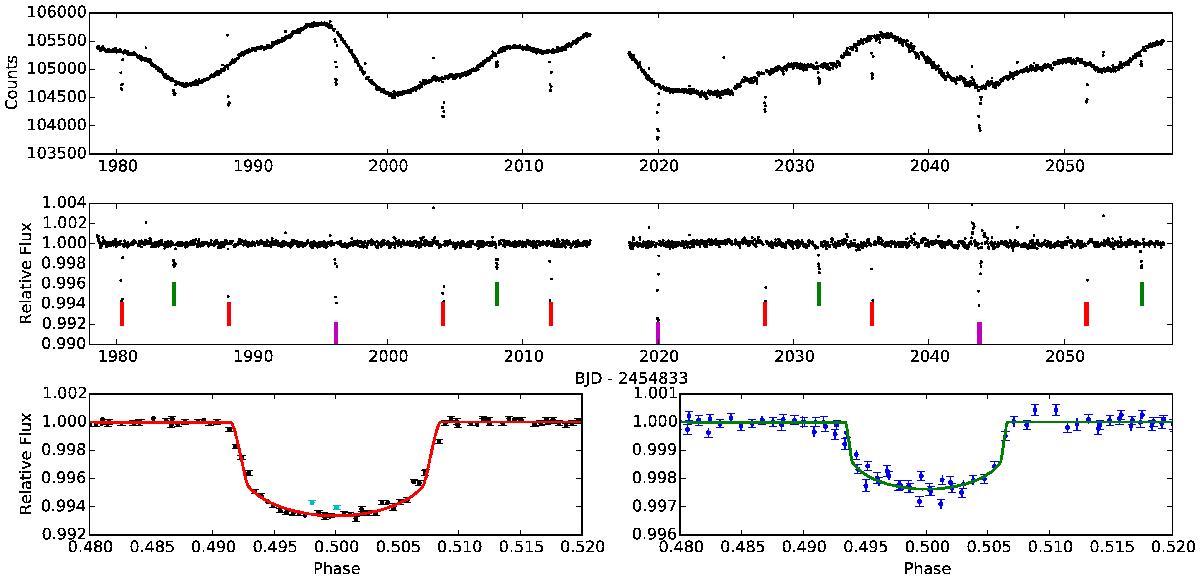
Top: extracted light curve for K2-19, showing significant stellar variability. Middle: flattened and detrended lightcurve, showing transits of the inner planet (b, red), outer planet (c, green) and simultaneous transits of both planets (magenta). Some outlier points are not shown for clarity. Bottom left: the phase folded transits of planet b, excluding simultaneous transits and showing the best fit model. Some points (shown lighter than the others) displayed clear evidence of spot crossings by the planet and were excluded from the fit. Bottom right: same for planet c. Note the change in y-axis scale.
Current usage metrics show cumulative count of Article Views (full-text article views including HTML views, PDF and ePub downloads, according to the available data) and Abstracts Views on Vision4Press platform.
Data correspond to usage on the plateform after 2015. The current usage metrics is available 48-96 hours after online publication and is updated daily on week days.
Initial download of the metrics may take a while.