Fig. 8
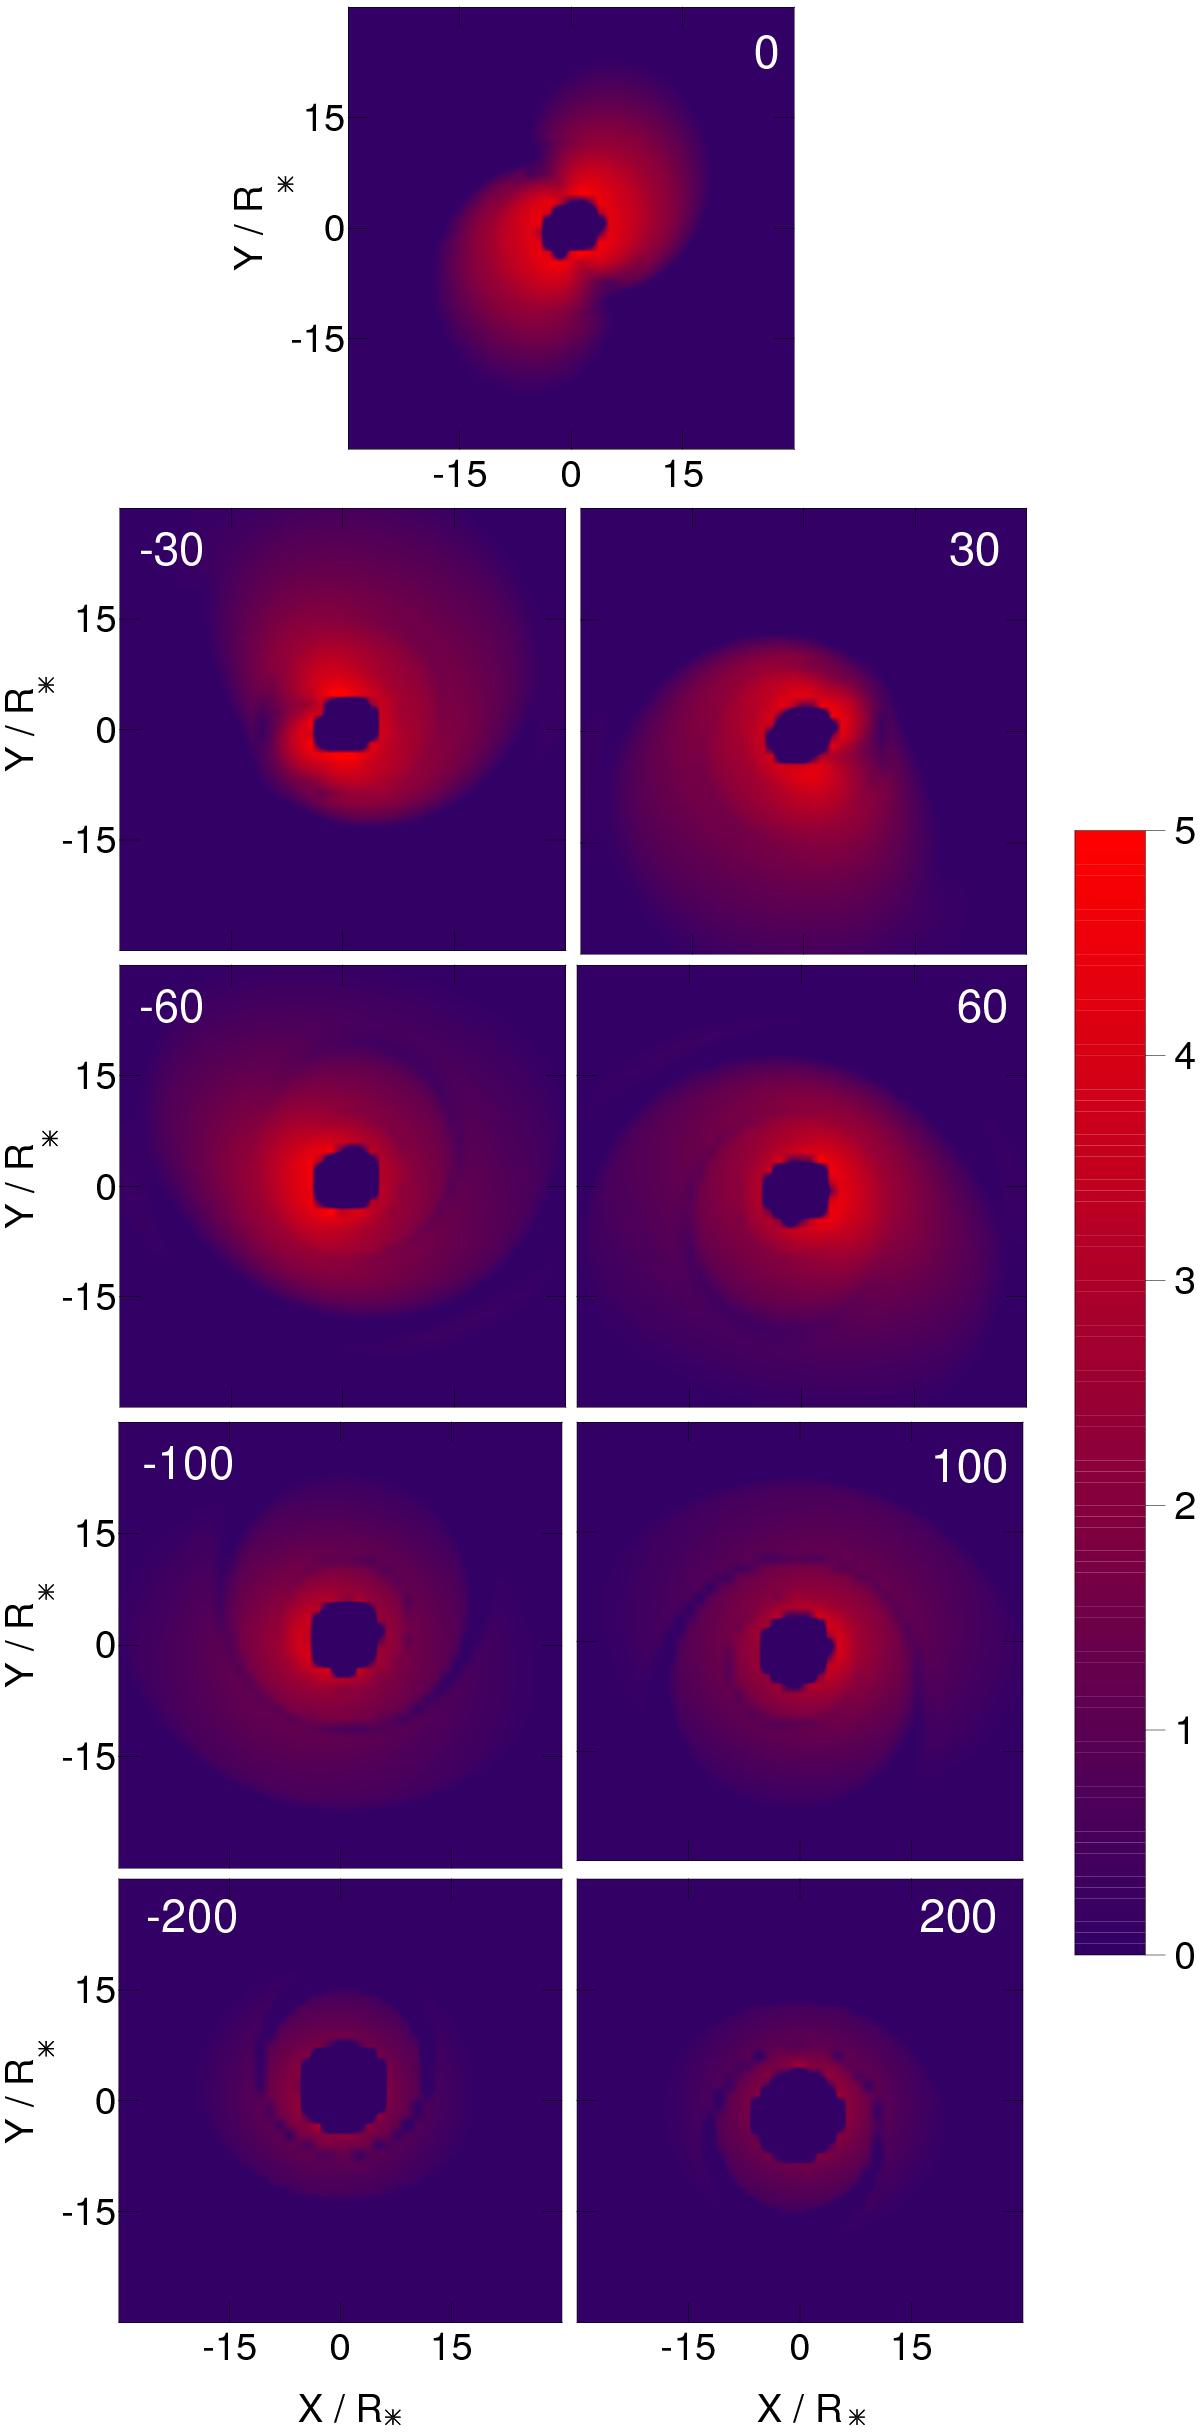
Brγ intensity distribution maps of our best disc-wind model P5 (see values of parameters in Table 3, Col. 3) in logarithmic scale (arbitrary units). Each panel shows the intensity map for a different radial velocity, indicated by a white label in units of km s-1. X and Y coordinates on each map are in R∗. The system axis inclination angle with respect to the line of sight is assumed to be 20° (see Table 2). Continuum emission from the disc and central star, located at coordinates 0, 0, are not shown.
Current usage metrics show cumulative count of Article Views (full-text article views including HTML views, PDF and ePub downloads, according to the available data) and Abstracts Views on Vision4Press platform.
Data correspond to usage on the plateform after 2015. The current usage metrics is available 48-96 hours after online publication and is updated daily on week days.
Initial download of the metrics may take a while.