Free Access
Fig. 6
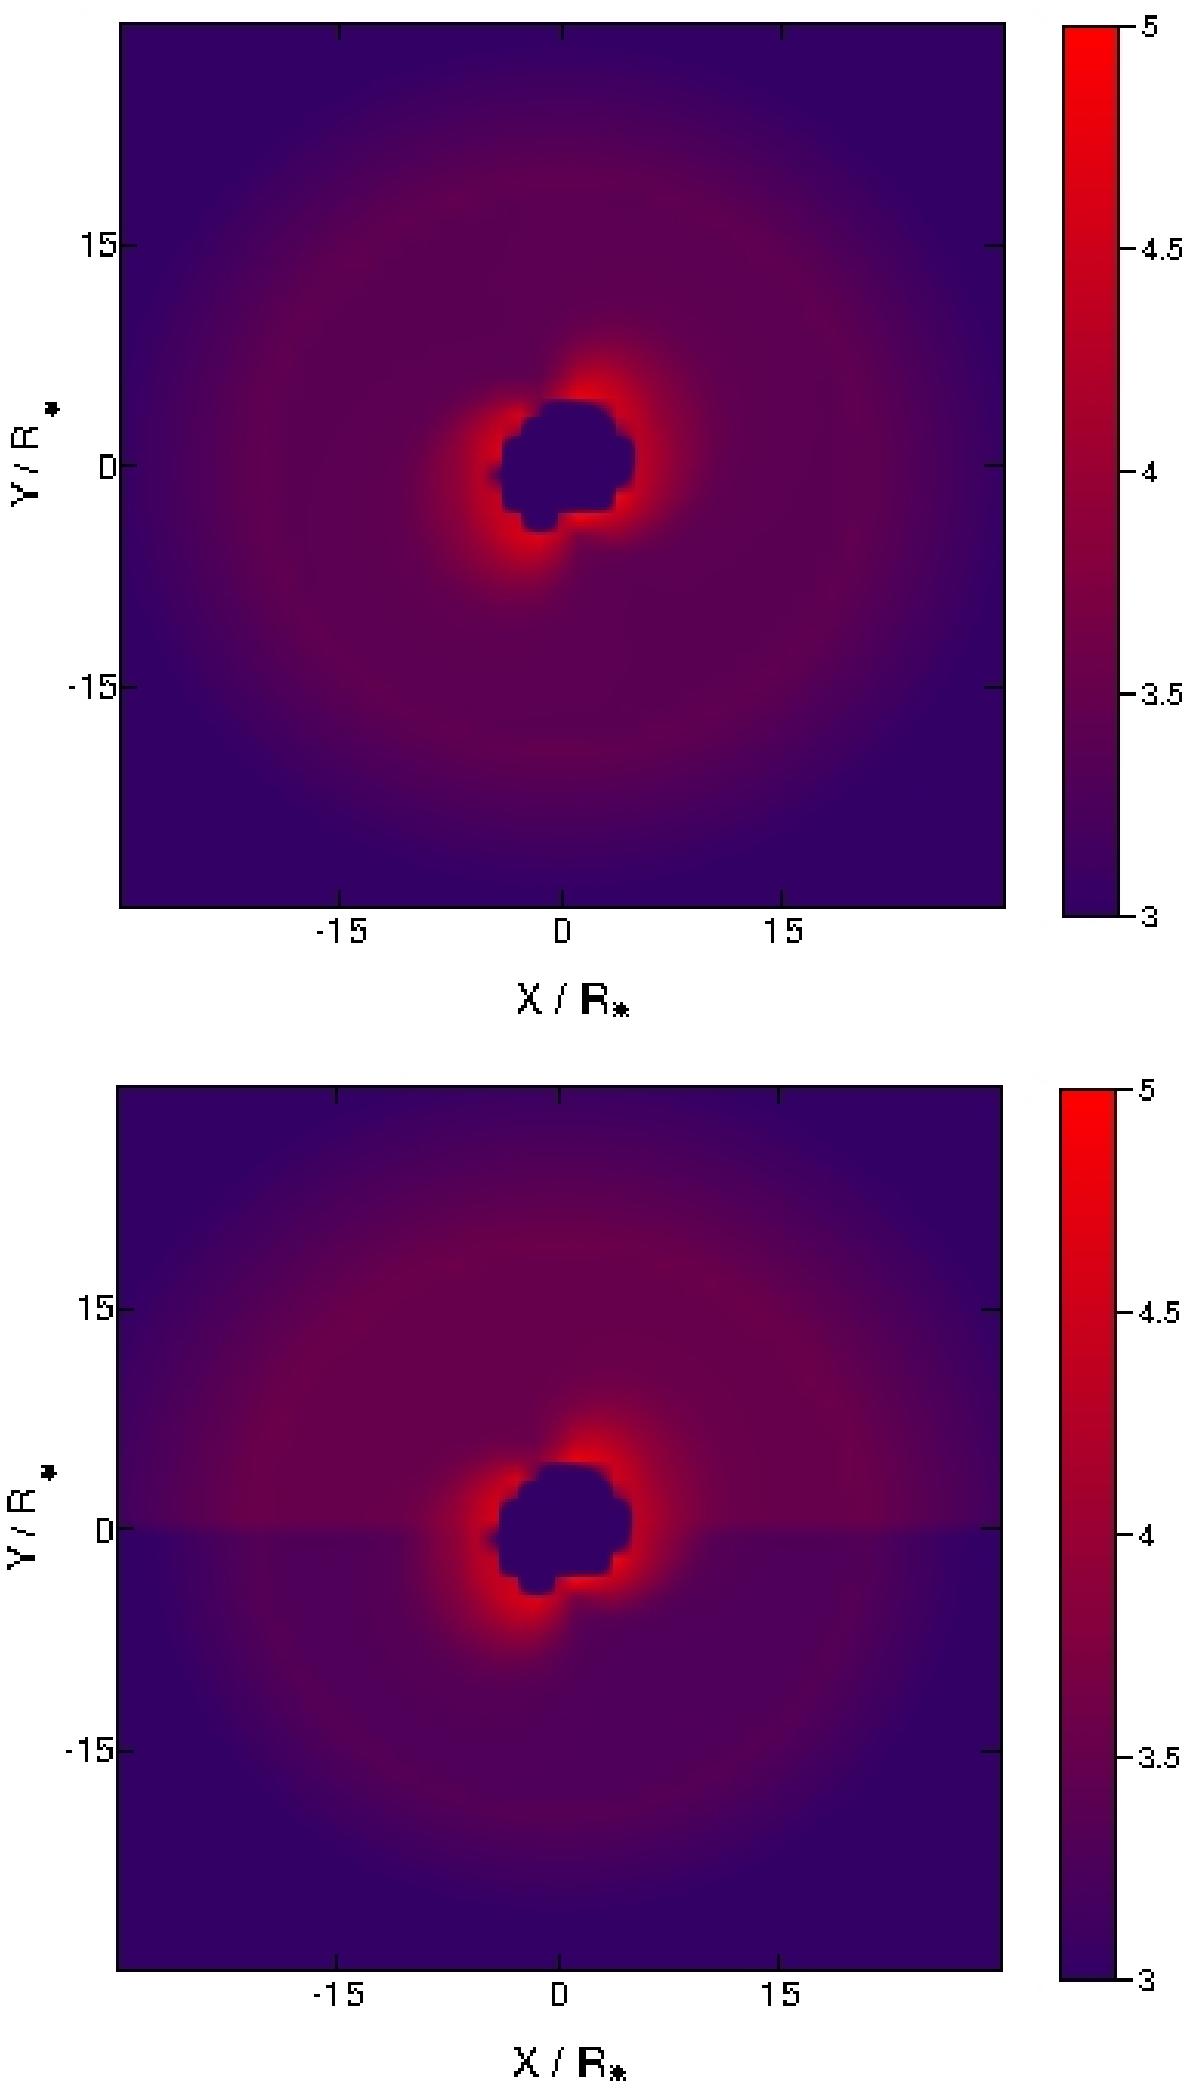
Upper panel: Brγ intensity distribution map (for vr = 0 km s-1) of the best-fit disc-wind model (P5) overlapped on the map of the disc continuum with symmetric brightness distribution. X and Y coordinates are in R∗. Lower panel: same as in the upper panel, but for the disc continuum with asymmetric brightness distribution.
Current usage metrics show cumulative count of Article Views (full-text article views including HTML views, PDF and ePub downloads, according to the available data) and Abstracts Views on Vision4Press platform.
Data correspond to usage on the plateform after 2015. The current usage metrics is available 48-96 hours after online publication and is updated daily on week days.
Initial download of the metrics may take a while.