Fig. 5
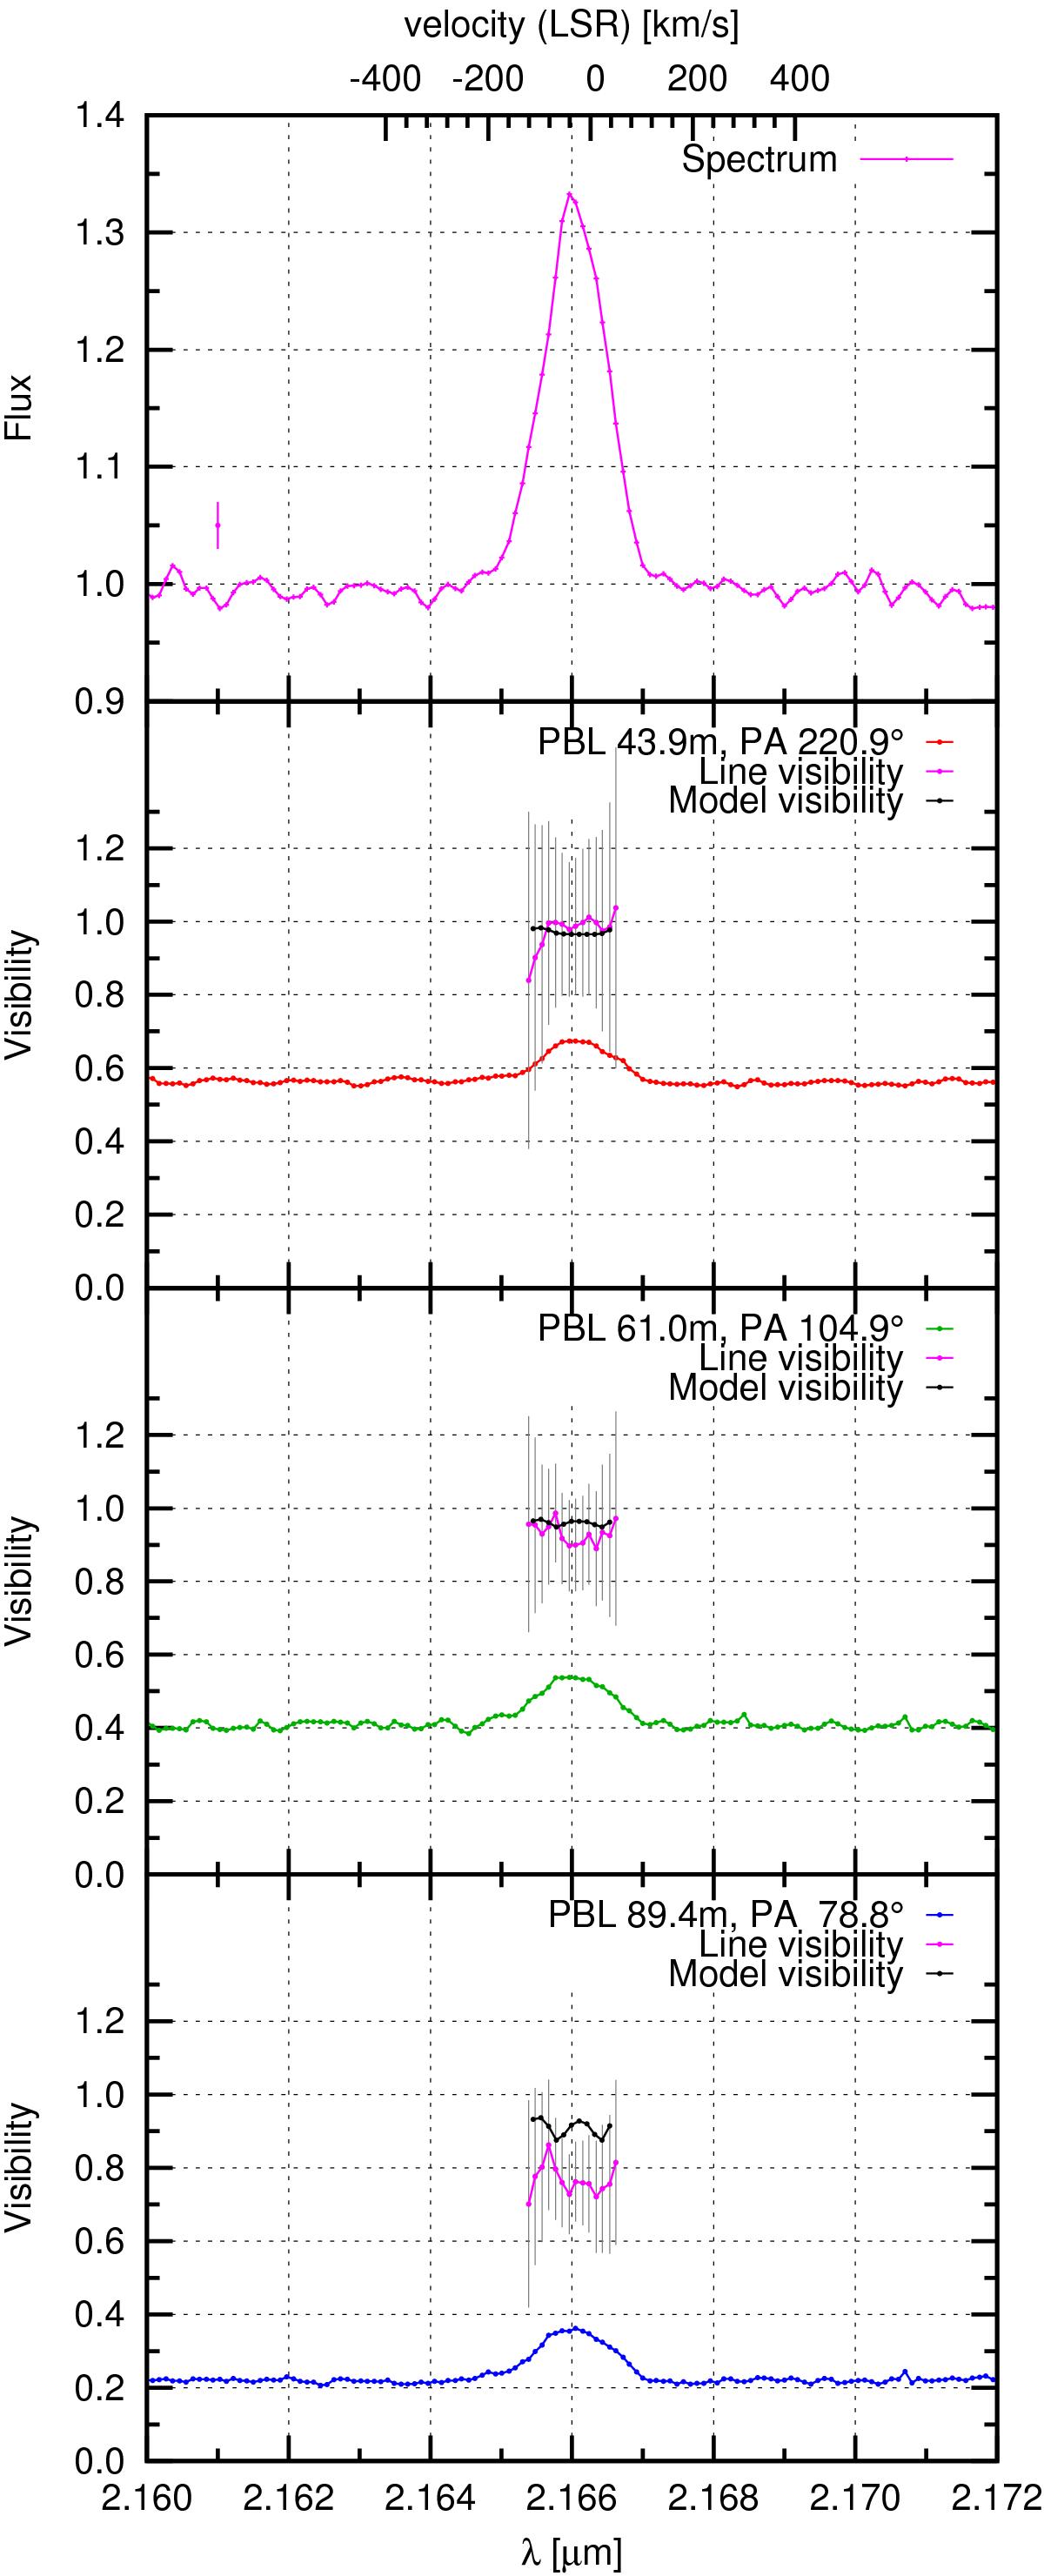
Comparison of the observed (pink solid lines) and modelled (black solid lines) continuum-corrected (pure) Brγ line visibilities of our AMBER observation of HD 98922. From top to bottom: wavelength dependence of flux and visibilities of the first, second, and third baseline. In each visibility panel the observed total visibilities (red, green, blue, as in Fig. 4), the observed pure Brγ line visibilities (pink), and the modelled pure Brγ line visibilities (black) are shown.
Current usage metrics show cumulative count of Article Views (full-text article views including HTML views, PDF and ePub downloads, according to the available data) and Abstracts Views on Vision4Press platform.
Data correspond to usage on the plateform after 2015. The current usage metrics is available 48-96 hours after online publication and is updated daily on week days.
Initial download of the metrics may take a while.