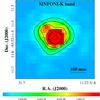
Fig. 3
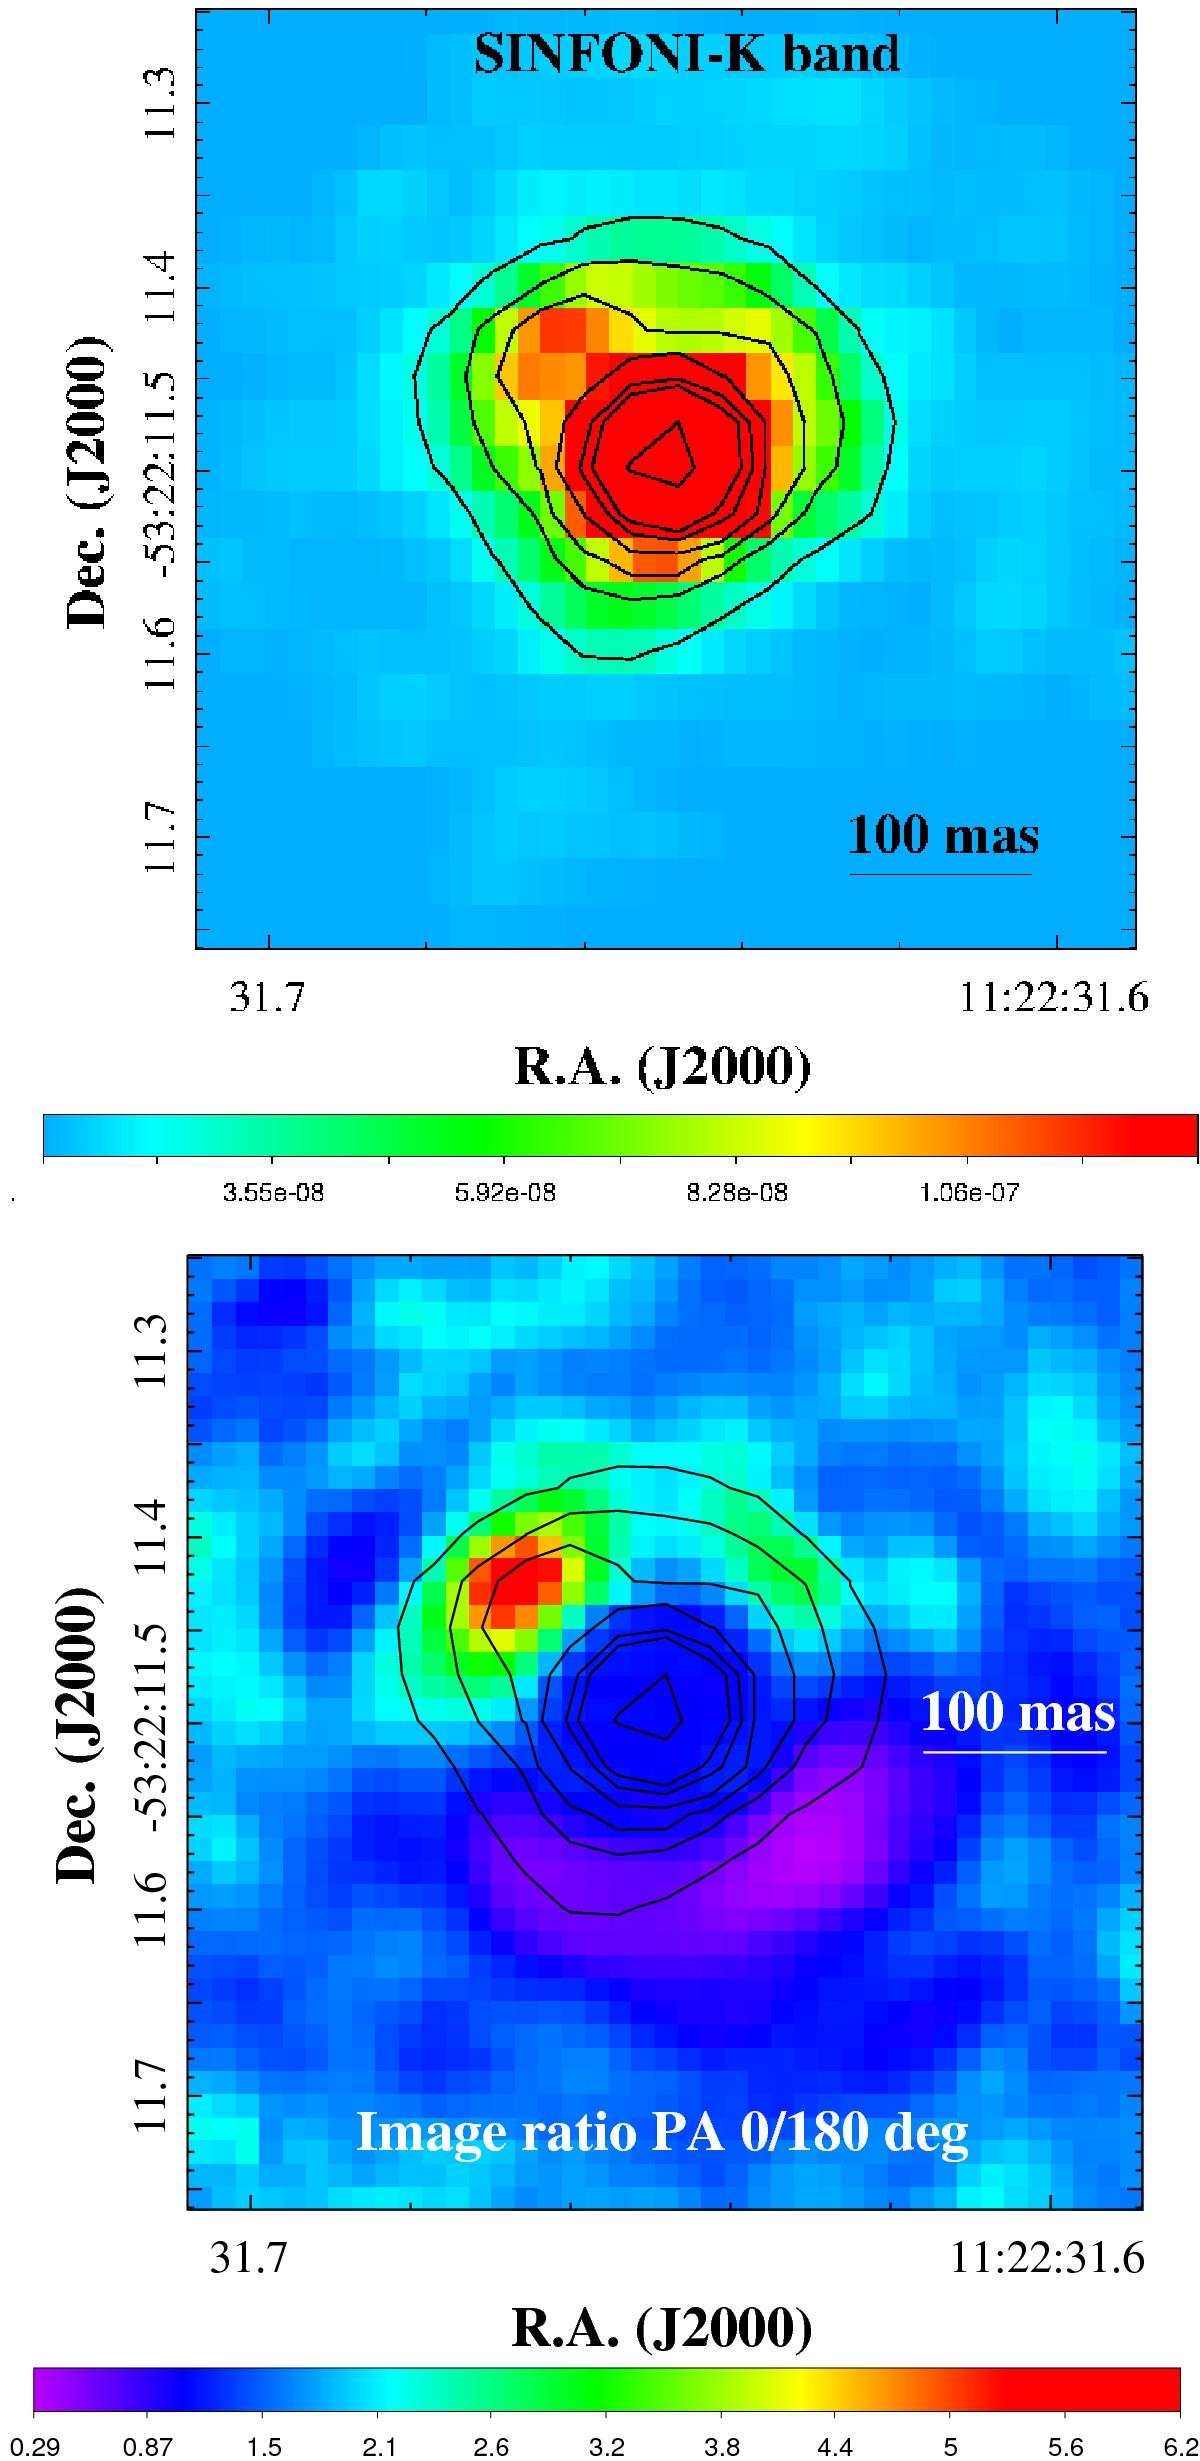
Upper panel: SINFONI K-band continuum image (between 2.15 and 2.16 μm). Labelled fluxes are in W m-2μm arcsec-2. Contour levels are 4, 5, 50, 150, 250, 400, 500, and 1000σ. Lower panel: intensity ratio image of two SINFONI K-band continuum images (between 2.15 and 2.16 μm) taken at PA of 0° and 180°, showing the asymmetric disc emission. Contours show the K-band continuum of the PA = 0° image (see upper panel), and give the position of both symmetric PSF in the centre, and asymmetric disc emission. Contour levels are as in the continuum image.
Current usage metrics show cumulative count of Article Views (full-text article views including HTML views, PDF and ePub downloads, according to the available data) and Abstracts Views on Vision4Press platform.
Data correspond to usage on the plateform after 2015. The current usage metrics is available 48-96 hours after online publication and is updated daily on week days.
Initial download of the metrics may take a while.