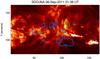
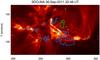
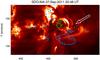
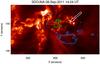
Fig. 4

Sequence of 193 Å (Fe XII; log T = 6.1) images taken by AIA/SDO a few minutes before each of the events listed in Table 1. The green and blue contours correspond to the vertical components of the photospheric magnetic field equal to +1000 G and –1000 G, respectively. The full temporal evolution is shown in the online movie.
Current usage metrics show cumulative count of Article Views (full-text article views including HTML views, PDF and ePub downloads, according to the available data) and Abstracts Views on Vision4Press platform.
Data correspond to usage on the plateform after 2015. The current usage metrics is available 48-96 hours after online publication and is updated daily on week days.
Initial download of the metrics may take a while.