Free Access
Fig. 8
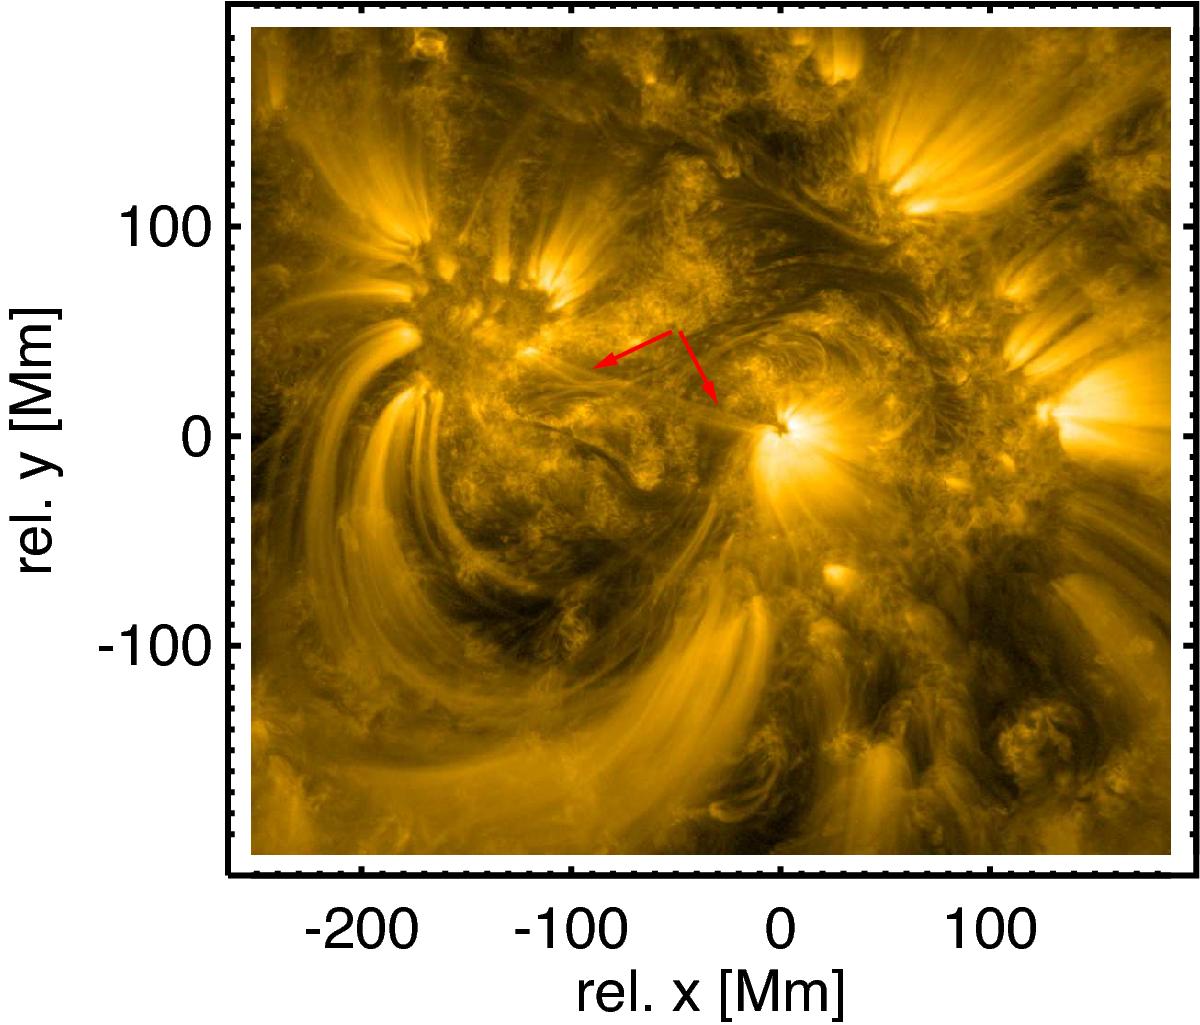
AIA 171 Å image of the same area as in Fig. 1, taken a day later on 2013 Sep. 3 14:20 UT. The coronal loops are indicated by red arrows, connecting the dark quadrant of the spot directly to the trailing plage of opposite polarity.
Current usage metrics show cumulative count of Article Views (full-text article views including HTML views, PDF and ePub downloads, according to the available data) and Abstracts Views on Vision4Press platform.
Data correspond to usage on the plateform after 2015. The current usage metrics is available 48-96 hours after online publication and is updated daily on week days.
Initial download of the metrics may take a while.