Fig. 5
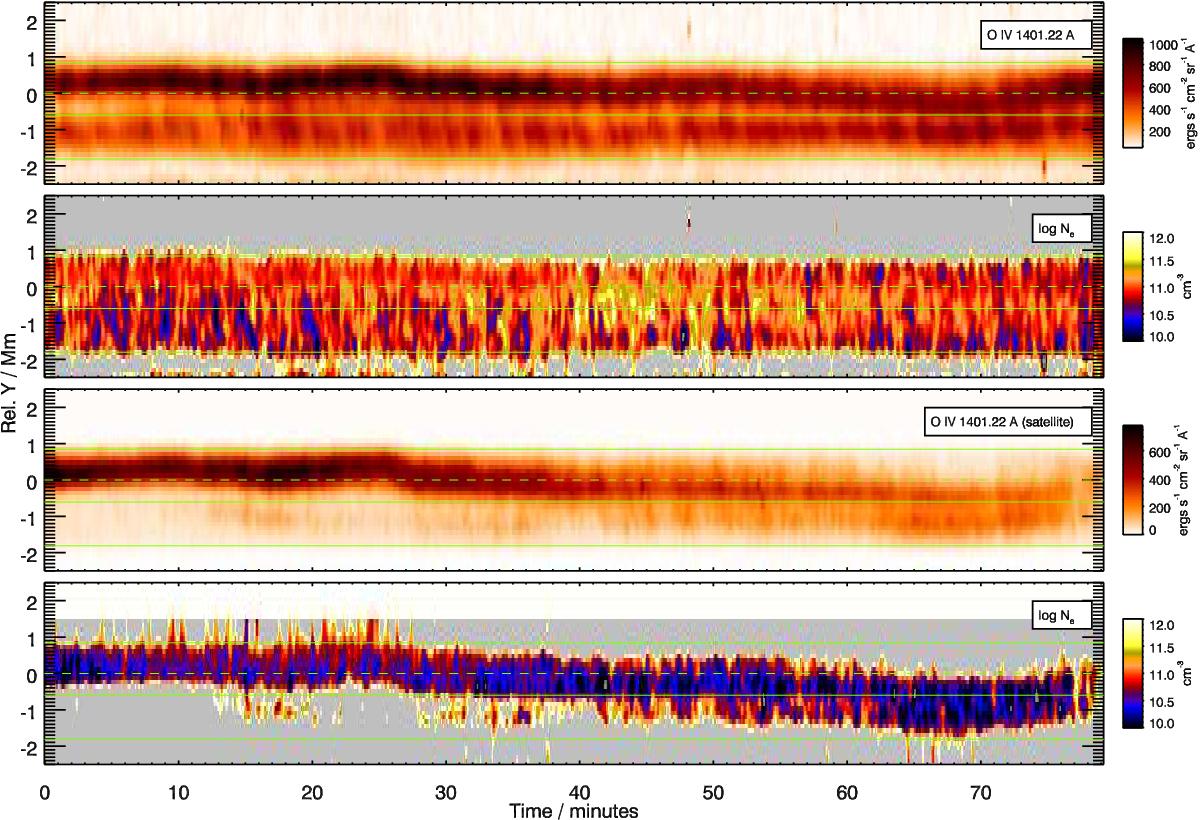
Variation in the intensity of the main component of the O iv 1401 Å line in the region that showed a supersonic downflow (first panel from the top), together with density inferred from the ratio of the O iv 1400 Å and 1401 Å lines (second panel). The variation of the intensity of the satellite line at 1401 Å (third panel) and the density from the ratio of the satellite lines at 1400 Å and 1401 Å are shown in the third and fourth panels, respectively. The horizontal lines mark the boundaries of the regions given in Fig. 1, where the dashed line indicates Point C.
Current usage metrics show cumulative count of Article Views (full-text article views including HTML views, PDF and ePub downloads, according to the available data) and Abstracts Views on Vision4Press platform.
Data correspond to usage on the plateform after 2015. The current usage metrics is available 48-96 hours after online publication and is updated daily on week days.
Initial download of the metrics may take a while.