Fig. 3
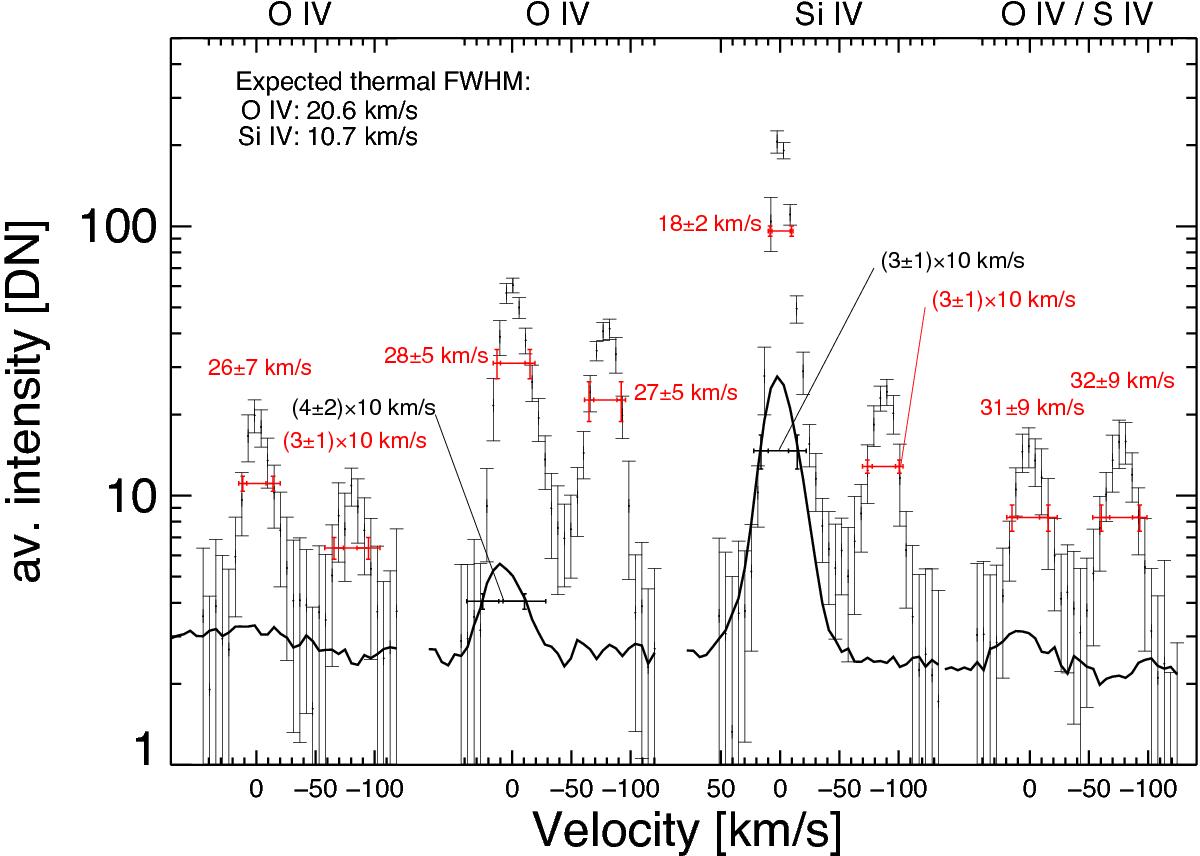
Symbols: 1-min average line profiles at Point C with error bars (standard deviation of the 20 individual measurements), taken 5 min before the reference spectrum in Fig. 1 (17:09 UT). At this time, the satellite lines in O iv are particularly strong. Solid line: average spectrum outside the spot. The main and satellite lines all have similar line widths (FWHM ~ 30 km s-1), with the exception of Si iv 1403 Å, which has a significantly narrower main component. The satellites are less pronounced in Si iv than in O iv.
Current usage metrics show cumulative count of Article Views (full-text article views including HTML views, PDF and ePub downloads, according to the available data) and Abstracts Views on Vision4Press platform.
Data correspond to usage on the plateform after 2015. The current usage metrics is available 48-96 hours after online publication and is updated daily on week days.
Initial download of the metrics may take a while.