Fig. 1
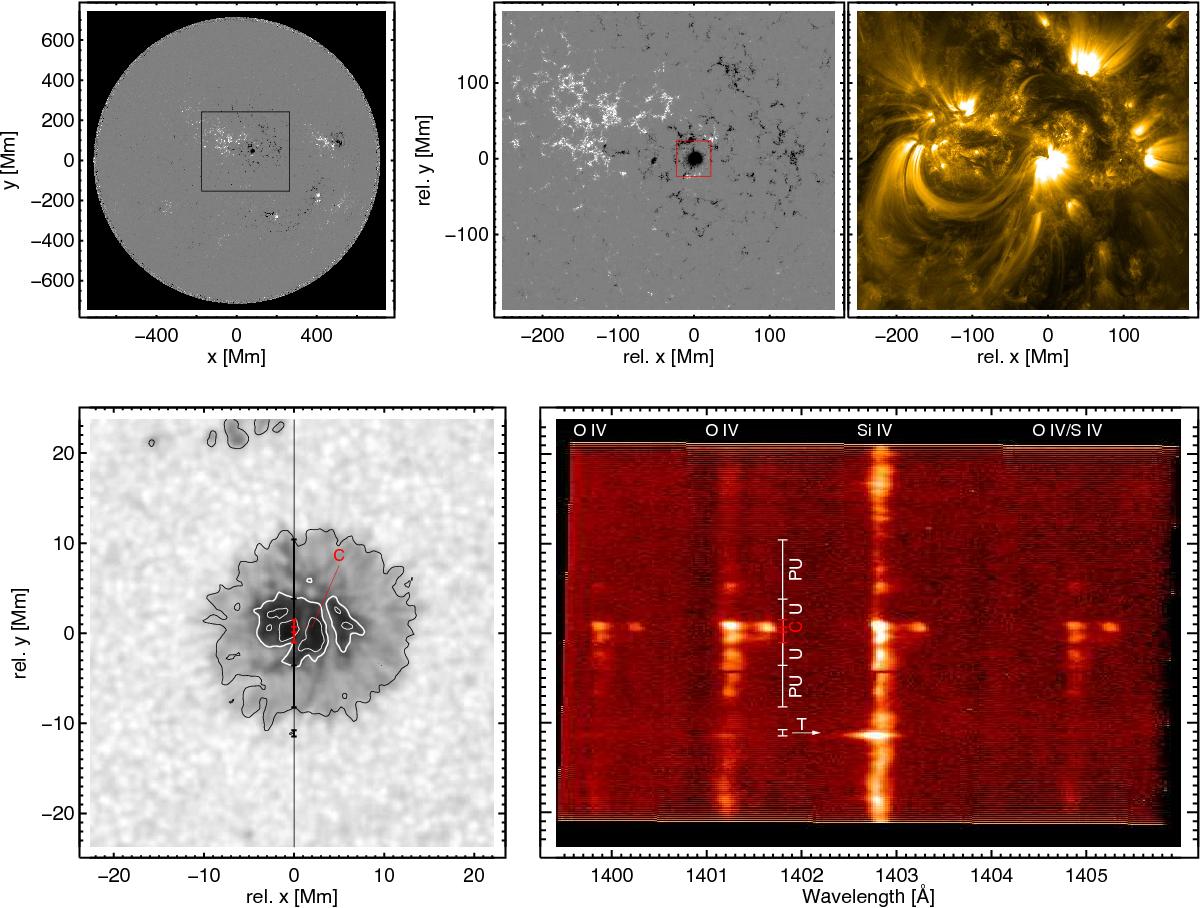
Upper panels (context images of AR 11836): full disk (left) and cut-out (middle) HMI magnetogram and corresponding AIA 171 Å image (right). Lower panels: zoom of HMI continuum image on the area marked by the red box in the upper panel, with the IRIS slit marked at x = 0 (left), and the corresponding spectra in the Si iv 1403 Å window averaged over 1 min (right panel). All data were taken on 2013 Sep. 2, 17:14 UT. Regions where the slit crosses the penumbra (PU) and umbra (U) are marked. The central part of the umbra, where the Si iv and O iv lines show satellites, is indicated in red. In the northern part, where the satellites are strongest, the centre of this region is labelled C and used as the reference point of the satellite feature in this report. The prominent upflow, labelled T, is due to a short-lived transient.
Current usage metrics show cumulative count of Article Views (full-text article views including HTML views, PDF and ePub downloads, according to the available data) and Abstracts Views on Vision4Press platform.
Data correspond to usage on the plateform after 2015. The current usage metrics is available 48-96 hours after online publication and is updated daily on week days.
Initial download of the metrics may take a while.