Free Access
Fig. 7
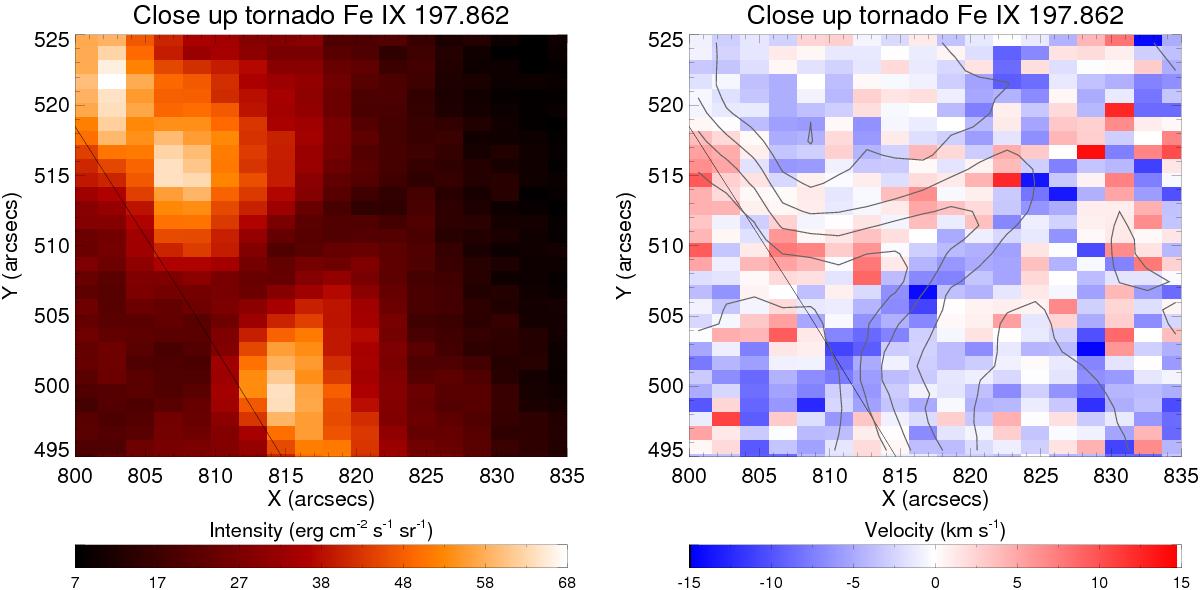
Intensity (left panel) and line-of-sight velocity (right panel) maps for the Fe ix 197.86 Å line. The contour plot on the velocity map is the Fe xii 195 Å line intensity (Fig. 3), that shows the tornado structure most clearly above the limb.
This figure is made of several images, please see below:
Current usage metrics show cumulative count of Article Views (full-text article views including HTML views, PDF and ePub downloads, according to the available data) and Abstracts Views on Vision4Press platform.
Data correspond to usage on the plateform after 2015. The current usage metrics is available 48-96 hours after online publication and is updated daily on week days.
Initial download of the metrics may take a while.