Fig. 5
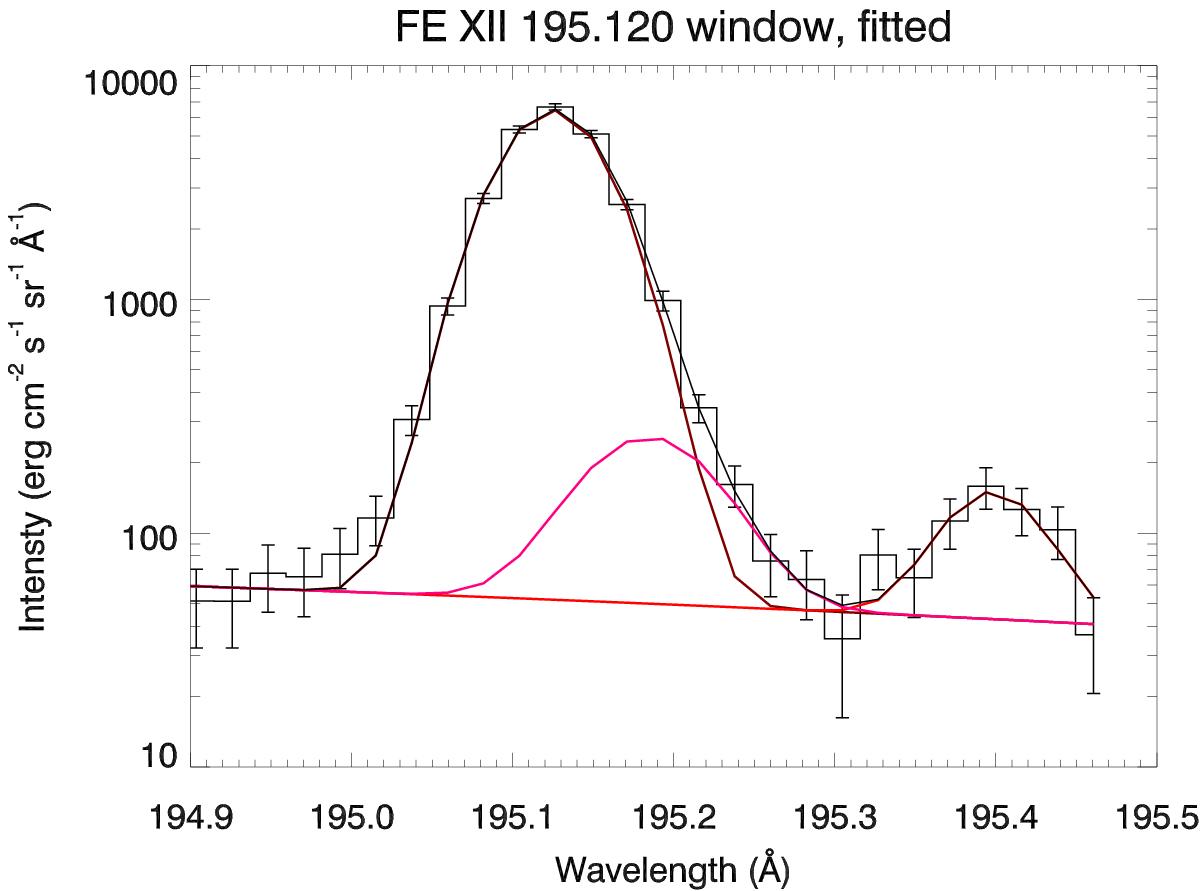
195 Å spectral window as seen by EIS, fitted with multiple Gaussians. Here the histogram with error bars is the raw data as measured by EIS, the dark red curve is the Fe xii 195.119 Å line and the magenta curve is the Fe xii 195.179 Å component. There is a third Gaussian fitted here, in red, at around 195.4 Å, that is an unidentified line. The solid black curve is the overall profile created from these Gaussians. The log scale on the y-axis emphasises the fits of the weaker lines.
Current usage metrics show cumulative count of Article Views (full-text article views including HTML views, PDF and ePub downloads, according to the available data) and Abstracts Views on Vision4Press platform.
Data correspond to usage on the plateform after 2015. The current usage metrics is available 48-96 hours after online publication and is updated daily on week days.
Initial download of the metrics may take a while.