Fig. 3
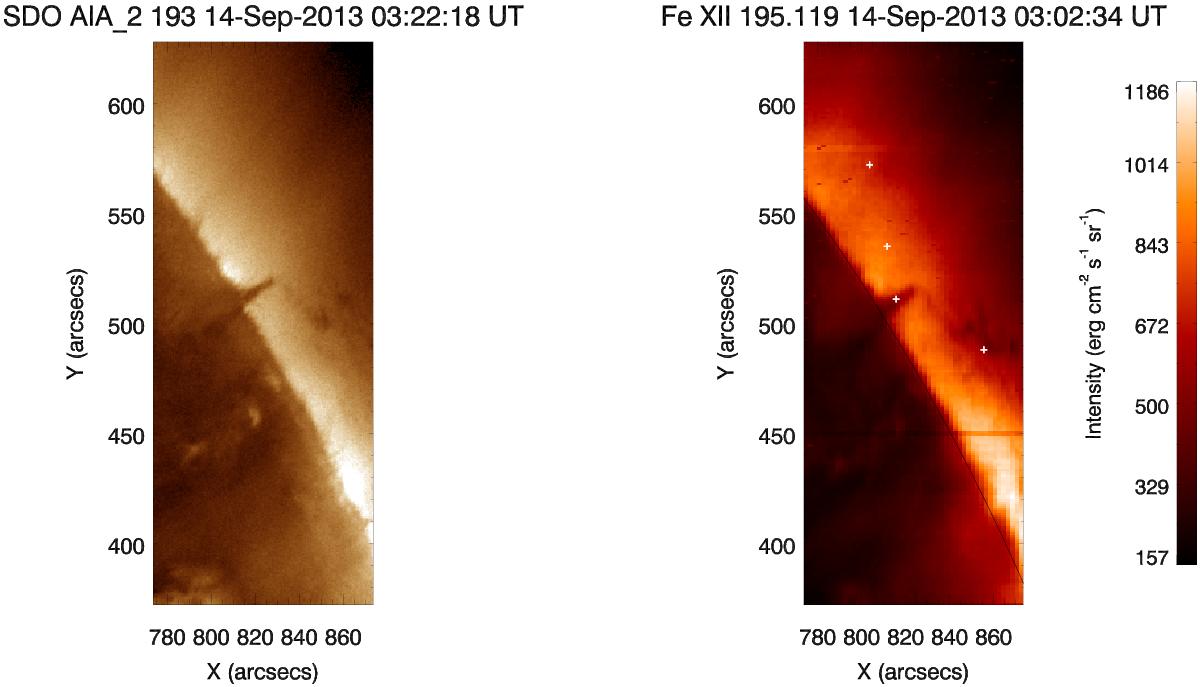
Intensity maps of the AIA 193 Å waveband (left) and the EIS Fe xii 195.12 Å spectral line obtained by Gaussian fitting (right), showing the tornado and the structure extending southwards above the limb. The plus markers in the EIS image (right) indicate the points at which the tornado, prominence and coronal DEMs presented in Sect. 6 are calculated. The AIA image is using the same waveband as the online movie, that shows the field of view of these images as a white rectangle.
Current usage metrics show cumulative count of Article Views (full-text article views including HTML views, PDF and ePub downloads, according to the available data) and Abstracts Views on Vision4Press platform.
Data correspond to usage on the plateform after 2015. The current usage metrics is available 48-96 hours after online publication and is updated daily on week days.
Initial download of the metrics may take a while.