Fig. 15
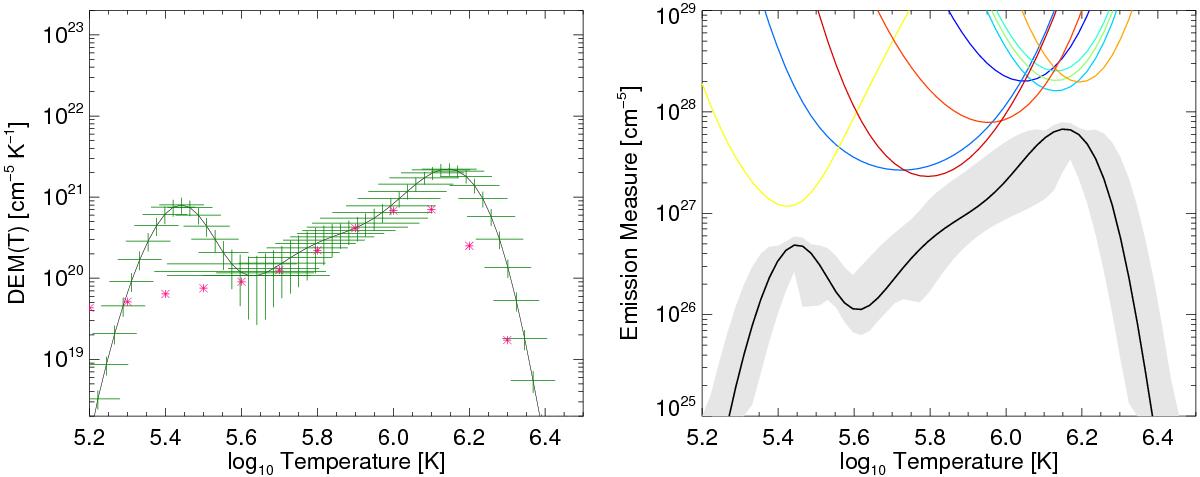
Result of the DEM code for a pixel in the tornado (see Fig. 3). Photospheric abundances were assumed for this DEM. Plotted here is the resulting differential emission measure (left panel) along with the emission measure distribution (right panel). Also plotted on the EMD panel (right) are the EM loci curves, or constraint curves, for each of the lines used in the DEM calculation (see Table 2 for line identification and formation temperatures). The green “error bars” in the DEM (left panel) and the grey ranges in the EMD (right panel) represent confidence regions for the DEM and EMD fits respectively. Plotted as pink asterisk markers on the DEM are the results from Parenti & Vial (2007) for a quiescent prominence.
Current usage metrics show cumulative count of Article Views (full-text article views including HTML views, PDF and ePub downloads, according to the available data) and Abstracts Views on Vision4Press platform.
Data correspond to usage on the plateform after 2015. The current usage metrics is available 48-96 hours after online publication and is updated daily on week days.
Initial download of the metrics may take a while.