Fig. 11
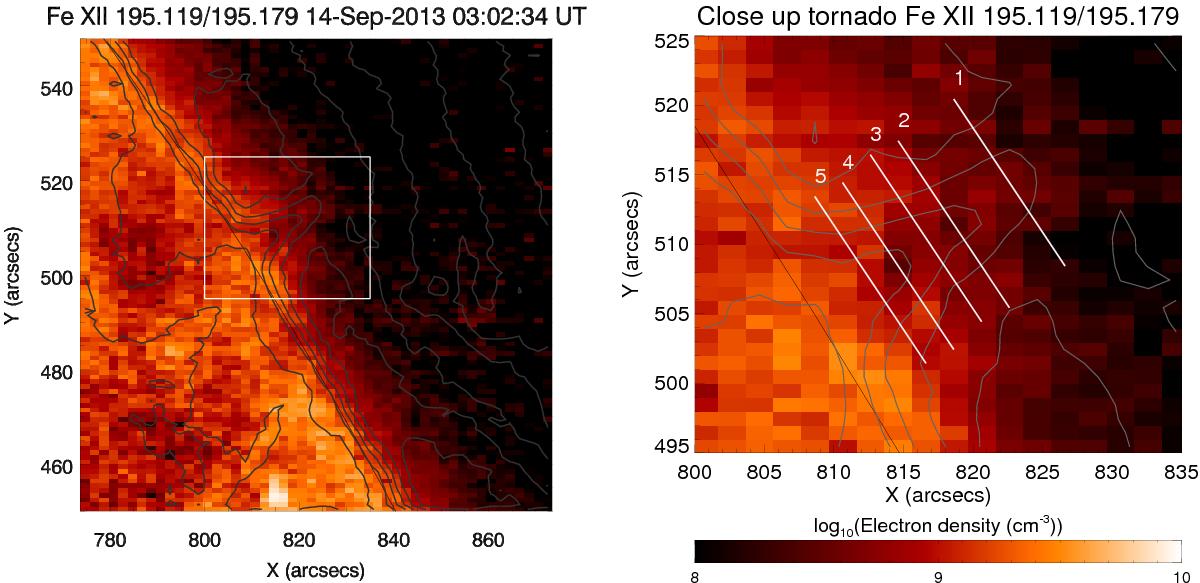
Density map for the Fe xii line pair at 195 Å. The right panel is a zoomed-in image, the dimensions of which are shown as a white box in the left hand panel. Overplotted on both is the contour of the 195.119 Å line, showing the position of the tornado. Also plotted on the right hand image are five parallel cuts through the tornado axis, used in Fig. 12.
Current usage metrics show cumulative count of Article Views (full-text article views including HTML views, PDF and ePub downloads, according to the available data) and Abstracts Views on Vision4Press platform.
Data correspond to usage on the plateform after 2015. The current usage metrics is available 48-96 hours after online publication and is updated daily on week days.
Initial download of the metrics may take a while.