Fig. 6
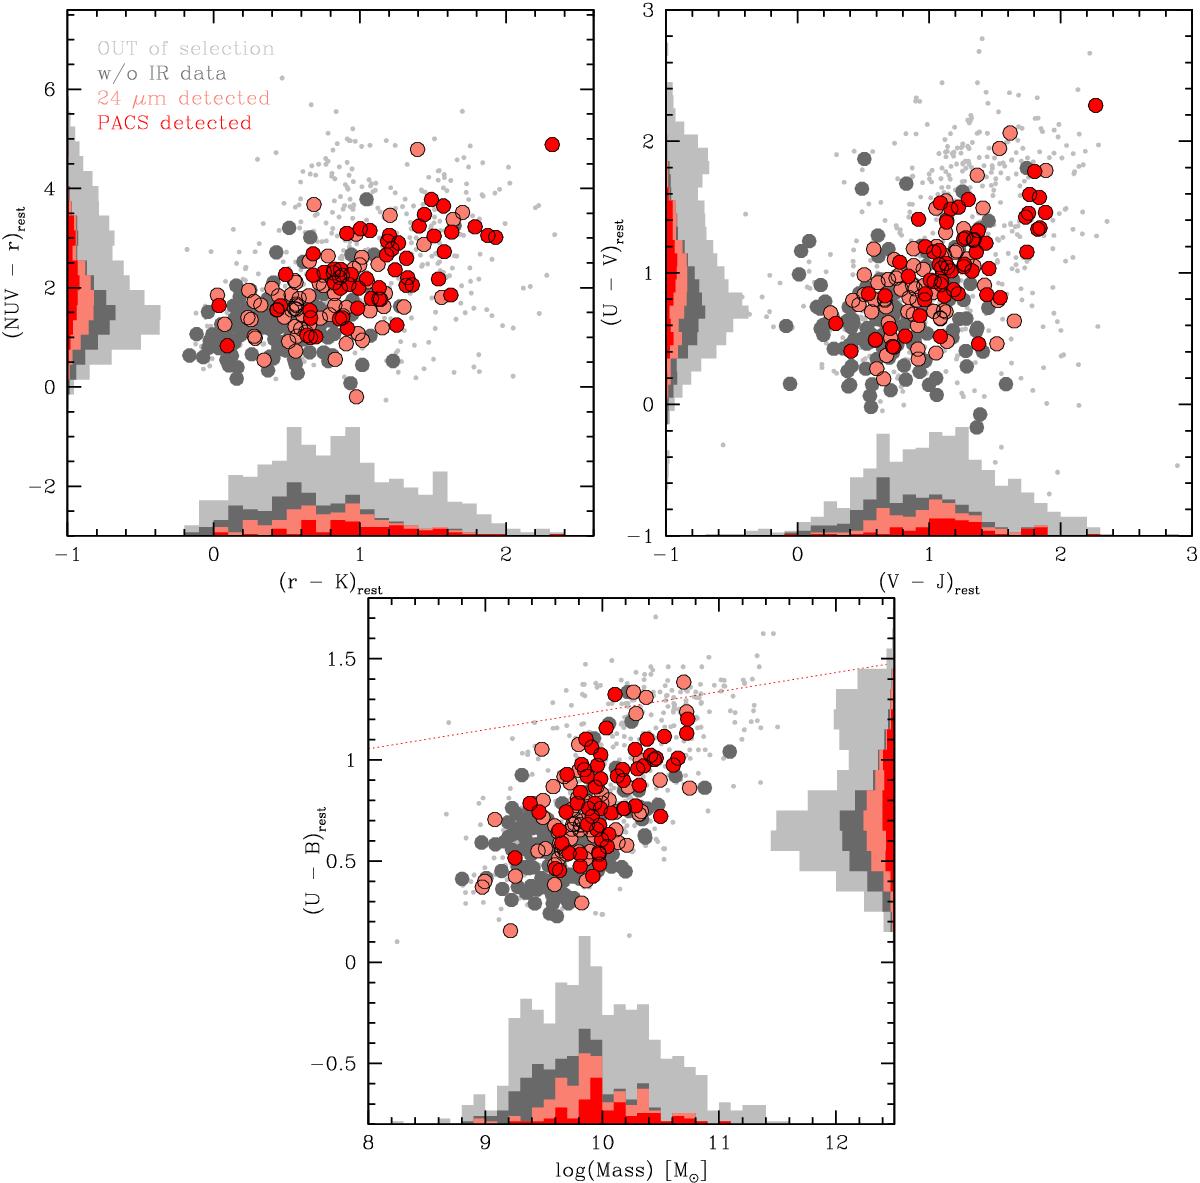
From top-left, clockwise: a) rest-frame (NUV − r) vs. (r − K) colour diagram (Arnouts et al. 2013); b) rest-frame (U − V) vs. (V − J) colour diagram (Williams et al. 2009); c) rest-frame colour (U − B) vs. stellar mass diagram. The red dotted line is the red sequence at z ~ 2 defined in Cassata et al. (2008). In all plots, small light grey dots represent the GMASS parent sample at z ≥ 1, while large points represent the final sample of 286 SFGs analysed in the paper. In particular: dark grey points indicate galaxies without IR data; salmon points indicate galaxies with a 24 μm detection; red points indicate galaxies with at least one PACS detection. The distribution of each quantity is shown by light grey histograms for the GMASS parent sample (#758), while dark grey histograms represent the distribution over the SFGs sample; salmon histograms represent galaxies with a 24 μm detection; red histograms represent galaxies with at least one PACS detection.
Current usage metrics show cumulative count of Article Views (full-text article views including HTML views, PDF and ePub downloads, according to the available data) and Abstracts Views on Vision4Press platform.
Data correspond to usage on the plateform after 2015. The current usage metrics is available 48-96 hours after online publication and is updated daily on week days.
Initial download of the metrics may take a while.