Fig. 4
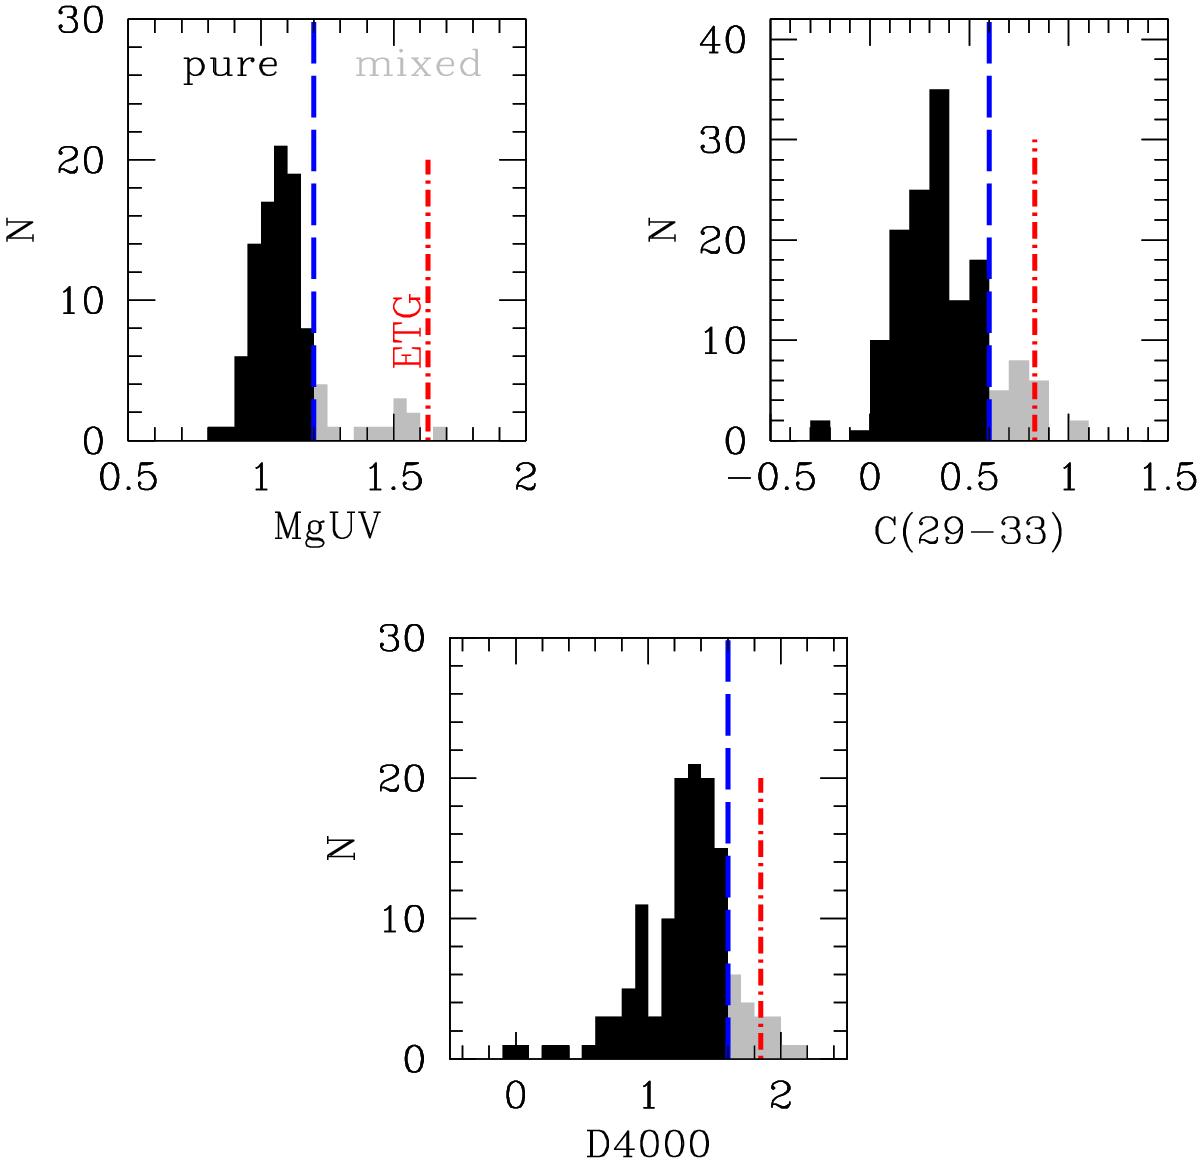
Continuum indices distribution over the [OII] sample: MgUV, C(29−33), D4000. In each plot the blue vertical line represents the threshold that separates SFGs from mixed galaxies (see the text for more details). The red lines mark the average value of each index measured on the GMASS quiescent galaxies at zspec ≥ 1, for reference.
Current usage metrics show cumulative count of Article Views (full-text article views including HTML views, PDF and ePub downloads, according to the available data) and Abstracts Views on Vision4Press platform.
Data correspond to usage on the plateform after 2015. The current usage metrics is available 48-96 hours after online publication and is updated daily on week days.
Initial download of the metrics may take a while.