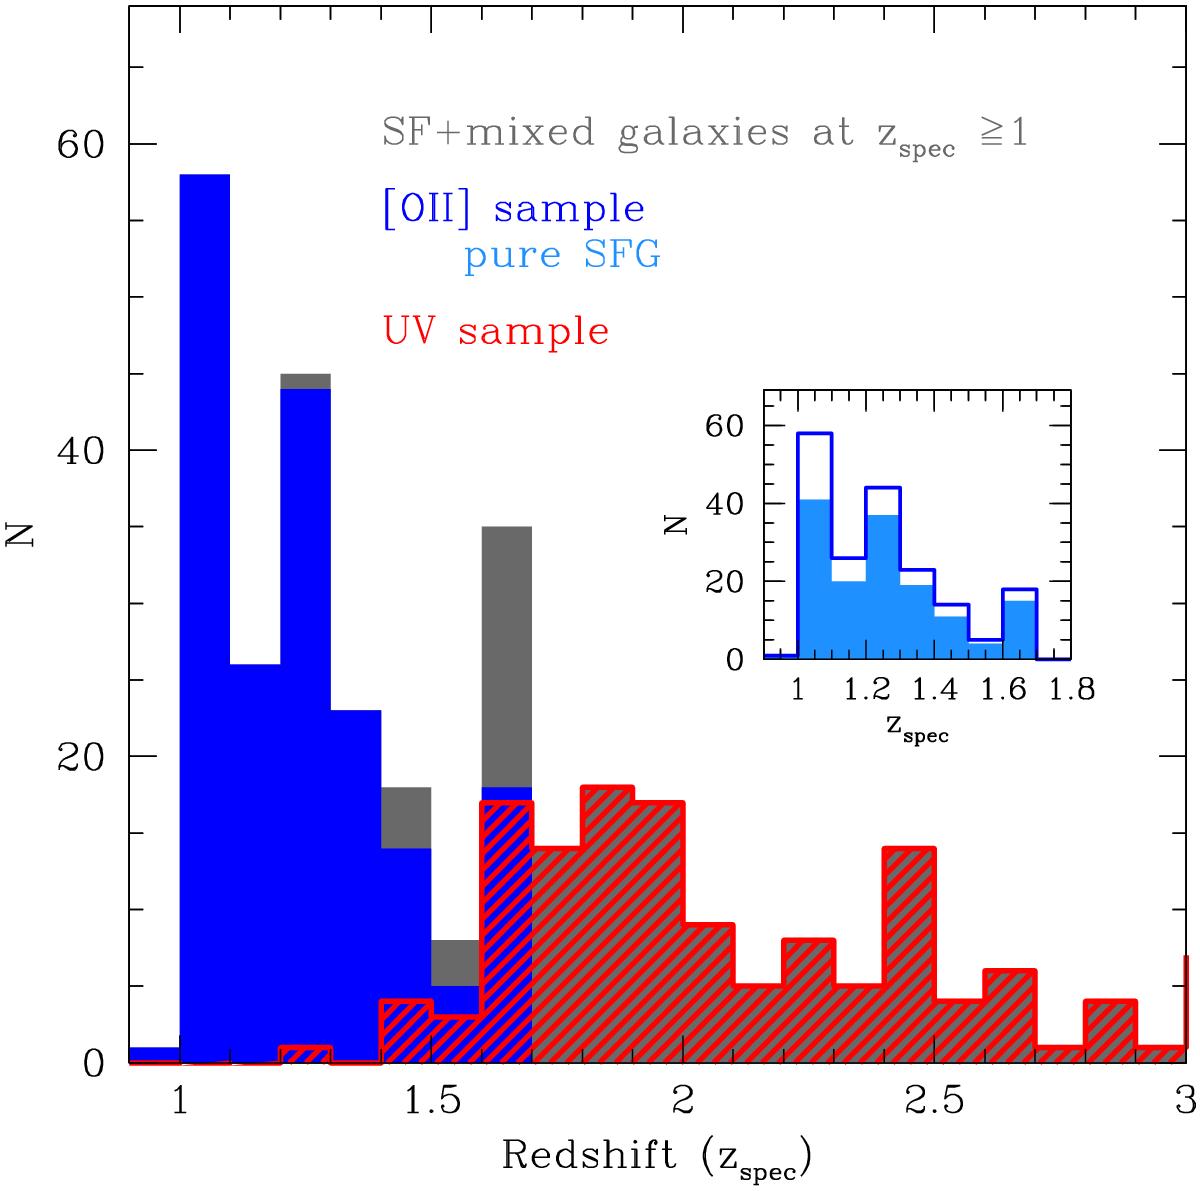
Fig. 3

Redsfhit distribution. Big plot: the grey histogram represents the preliminary selection of 327 SF+mixed galaxies; the blue histogram represents the [OII] sample (i.e. spectra covering the wavelength range ~2700−4300 Å); the red histogram represents the UV sample (i.e. spectra covering the wavelength range ~1100−2800 Å). Little inset: zoom of the [OII] sample: empty blue histogram represents the total [OII] sample, while light blue shaded histogram represents only not-mixed SFGs in the [OII] sample.
Current usage metrics show cumulative count of Article Views (full-text article views including HTML views, PDF and ePub downloads, according to the available data) and Abstracts Views on Vision4Press platform.
Data correspond to usage on the plateform after 2015. The current usage metrics is available 48-96 hours after online publication and is updated daily on week days.
Initial download of the metrics may take a while.


