Fig. 2
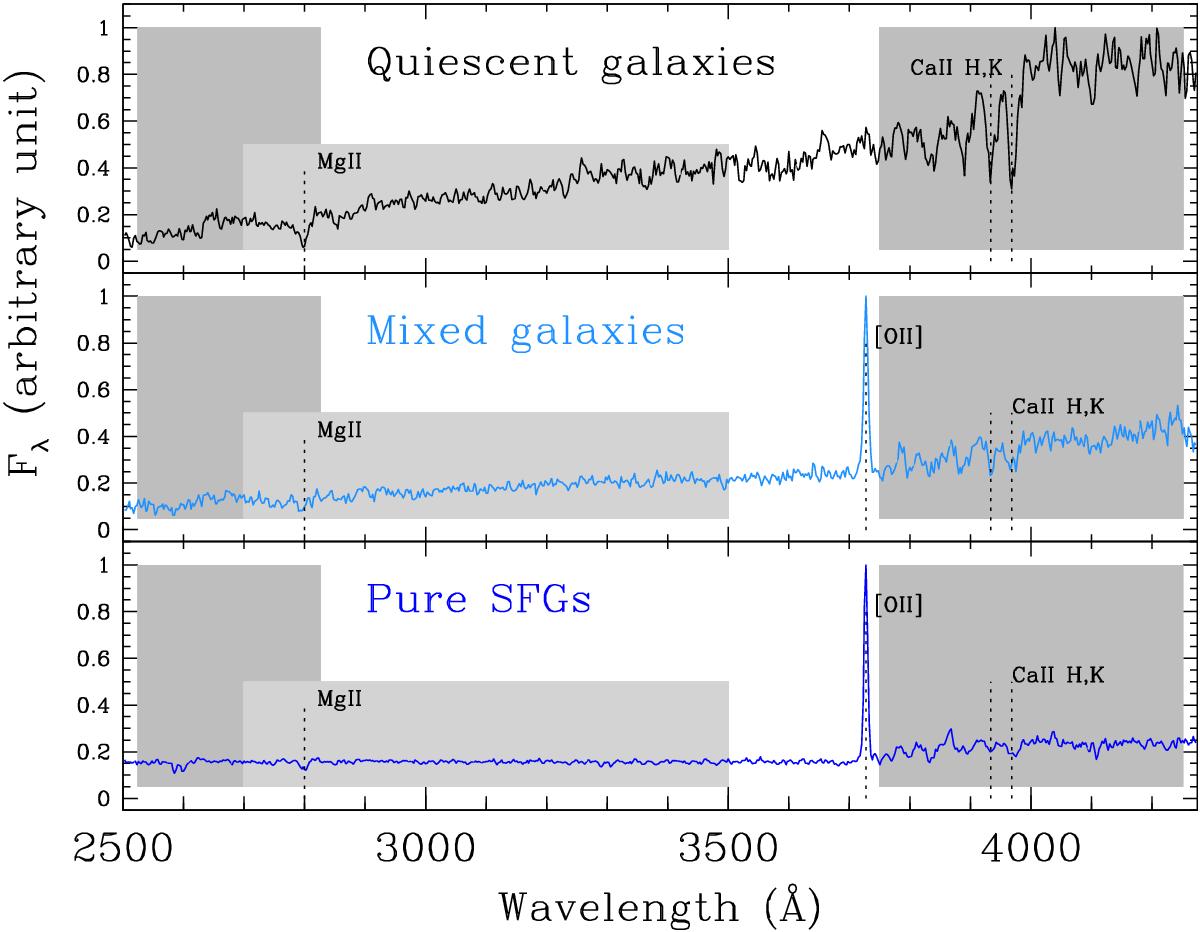
From top to bottom: a) average spectrum of 33 quiescent galaxies in the GMASS sample; b) average spectrum of mixed galaxies in the [OII] sample, at 1 <z< 1.6; c) average spectrum of not-mixed SFGs in the [OII] sample, at 1 <z< 1.6. Mixed galaxies have high values of the three continuum indices indicated by grey shaded regions: MgUV (2600−2900 Å) (Daddi et al. 2005); C(29−33) (2900−3300 Å) (Cimatti et al. 2008); D4000 break (3750−4250 Å) (Bruzual A. 1983). See the text and Fig. 4 for more details.
Current usage metrics show cumulative count of Article Views (full-text article views including HTML views, PDF and ePub downloads, according to the available data) and Abstracts Views on Vision4Press platform.
Data correspond to usage on the plateform after 2015. The current usage metrics is available 48-96 hours after online publication and is updated daily on week days.
Initial download of the metrics may take a while.