Fig. 19
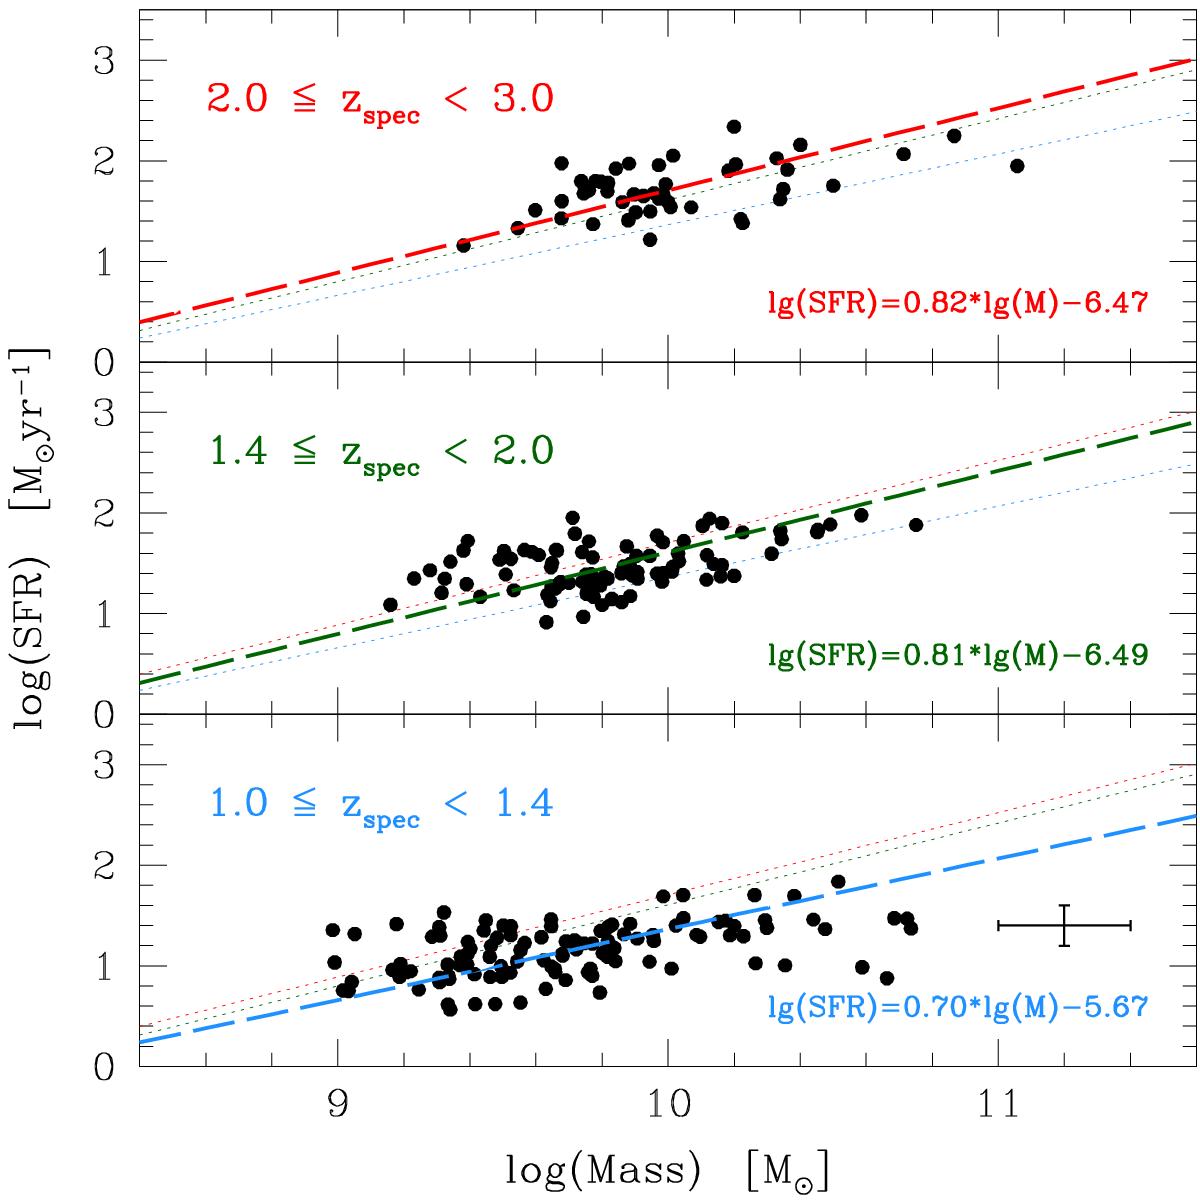
SFR vs. Mass in three redshift bins, each spanning ~1.2 Gyr. For each galaxy, the plotted SFR estimate is SFRIR + UV for IR-detected galaxies and SFR[OII]0 or SFRUV0 for galaxies with no IR data respectively in the [OII] sample and in the UV sample. In each panel the three lines are the fits (OLS bisector) to the data in the three redshift bins. Different colours identify each redshift bin.
Current usage metrics show cumulative count of Article Views (full-text article views including HTML views, PDF and ePub downloads, according to the available data) and Abstracts Views on Vision4Press platform.
Data correspond to usage on the plateform after 2015. The current usage metrics is available 48-96 hours after online publication and is updated daily on week days.
Initial download of the metrics may take a while.