Fig. 15
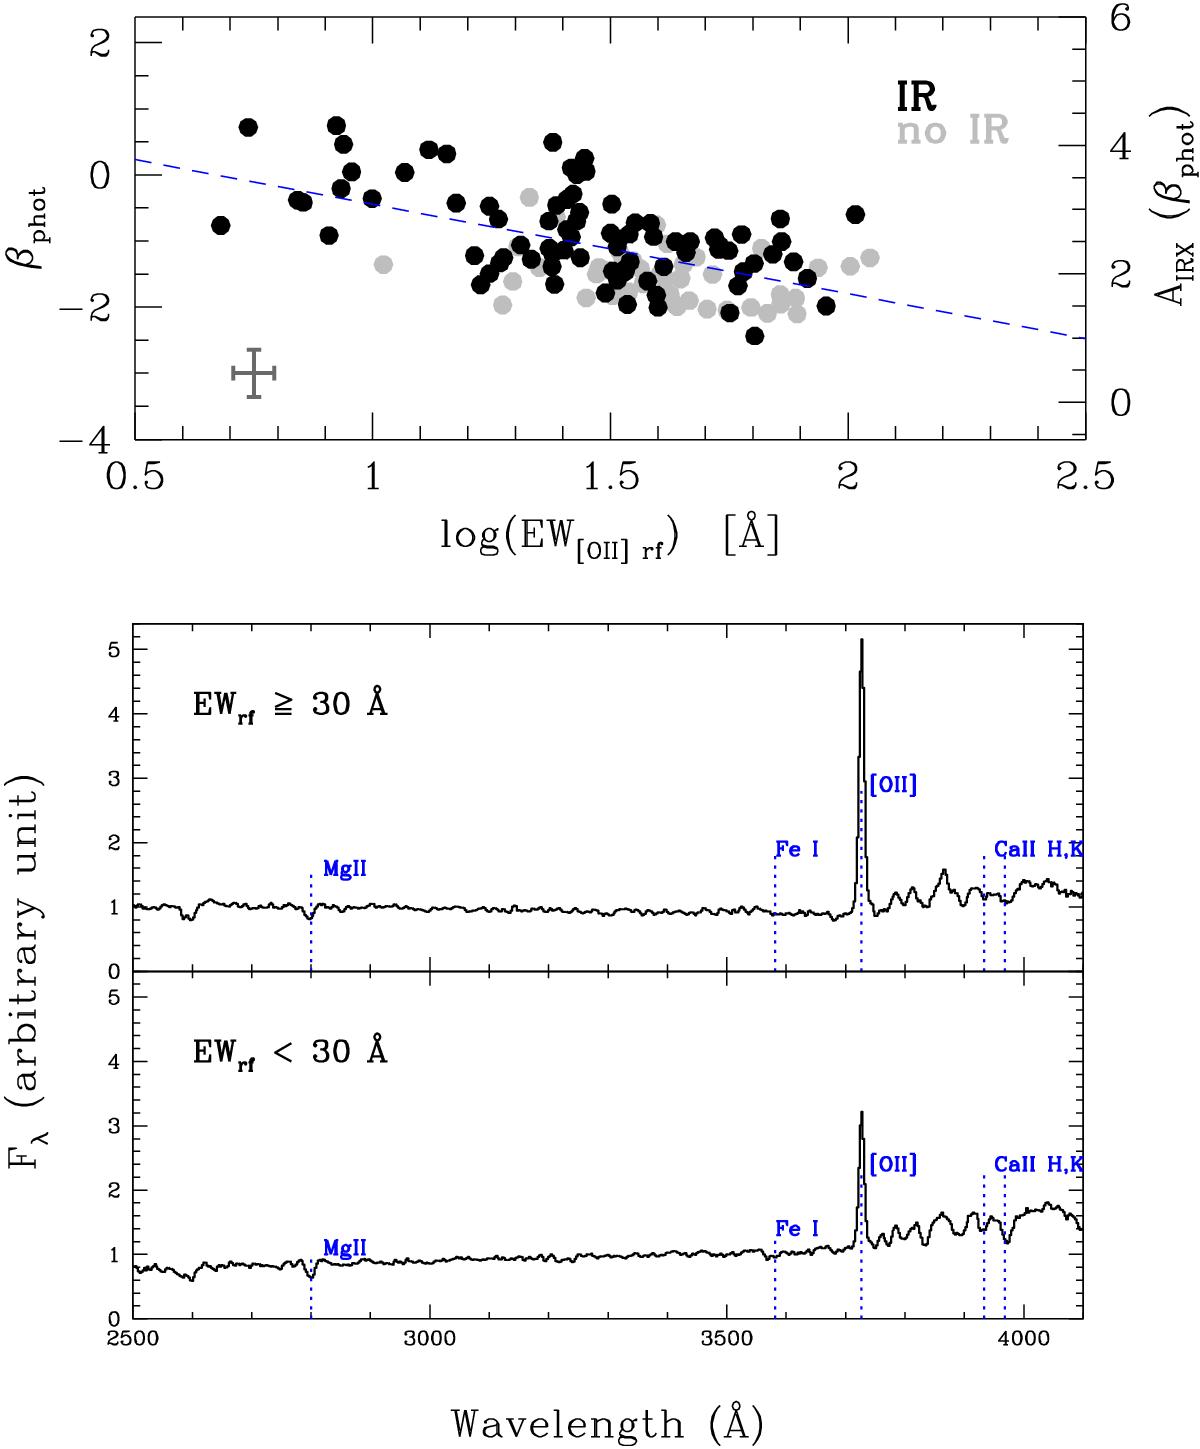
Top: βphot vs. log(EW[OII]) rest-frame. We use the convention of positive EW for emission lines. The right axis converts βphot to AIRX using Eq. (11). Black points represent IR-detected galaxies, while grey points represent galaxies with no IR detection. The blue dashed line is a linear fit to the points. Bottom: average spectra in two bins of rest-frame EW[OII]. Lines of interest are labelled.
Current usage metrics show cumulative count of Article Views (full-text article views including HTML views, PDF and ePub downloads, according to the available data) and Abstracts Views on Vision4Press platform.
Data correspond to usage on the plateform after 2015. The current usage metrics is available 48-96 hours after online publication and is updated daily on week days.
Initial download of the metrics may take a while.