Fig. 14
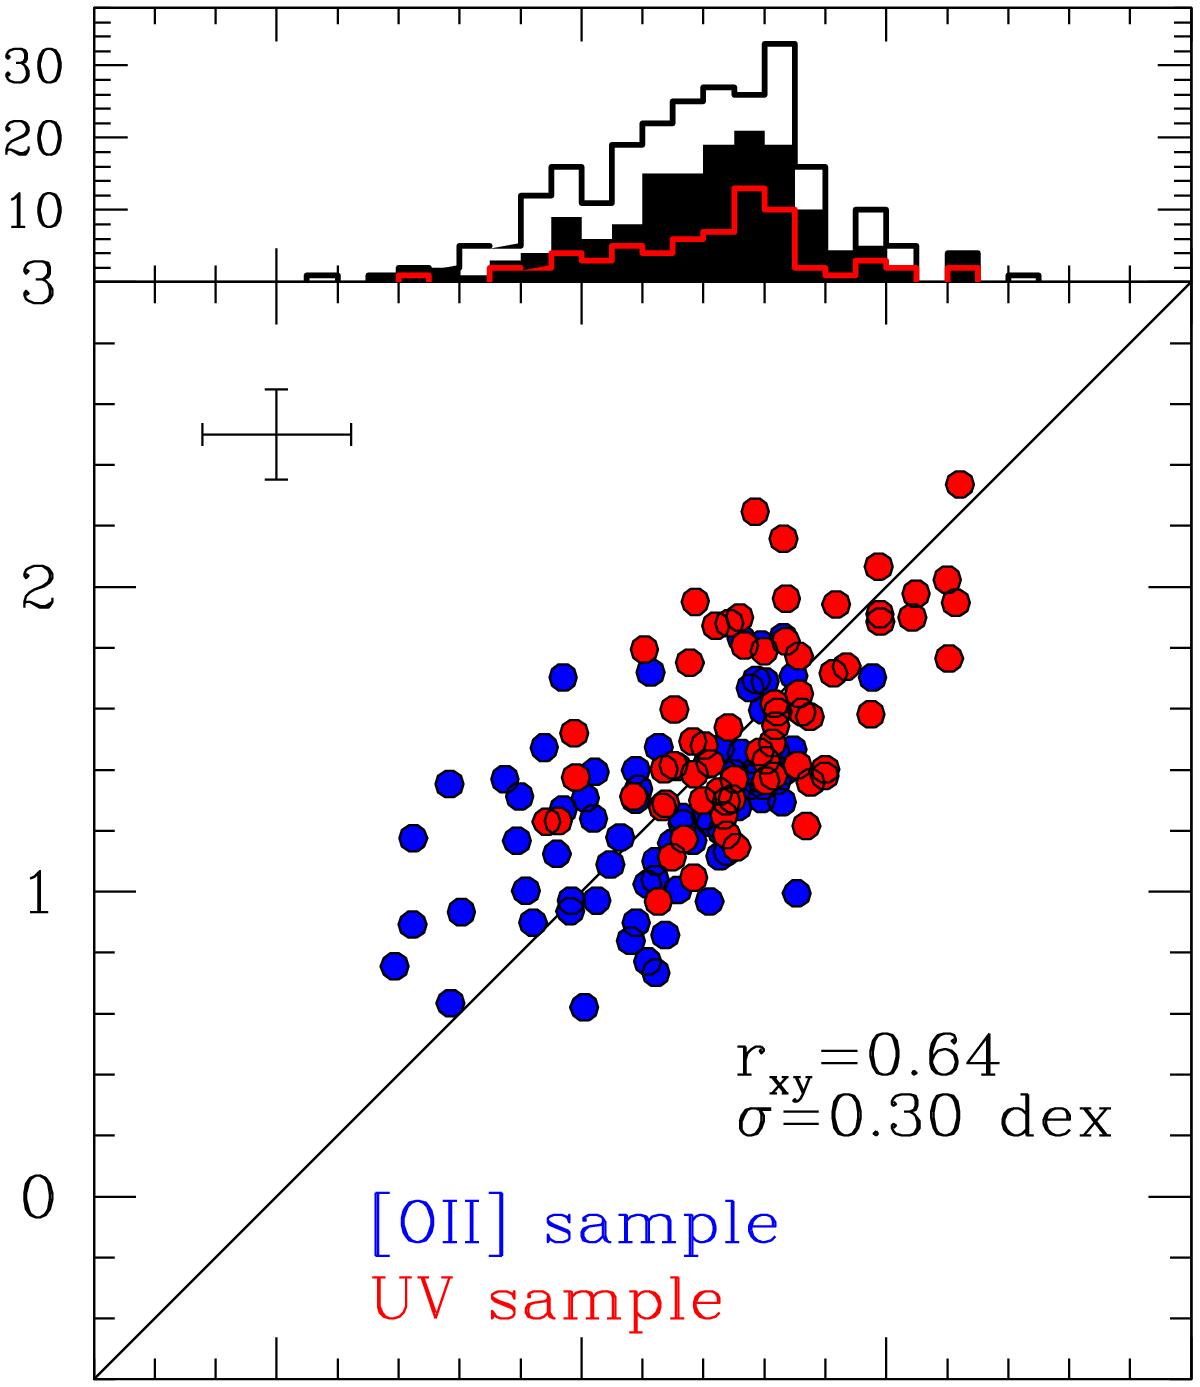
Main plot: comparison between SFRIR + UV and SFRUV0 corrected using the AIRX vs. β relations derived in the paper. β is derived from spectroscopy, when possible, otherwise from photometry (see the text for more details). Upper plot: black empty histogram is the distribution of SFRUV0 over the entire sample of SFGs; black filled histogram is the distribution of SFRUV0 over the sample of 24 μm-detected sources (both with and without PACS data); red empty histogram is the distribution of PACS-detected sources only.
Current usage metrics show cumulative count of Article Views (full-text article views including HTML views, PDF and ePub downloads, according to the available data) and Abstracts Views on Vision4Press platform.
Data correspond to usage on the plateform after 2015. The current usage metrics is available 48-96 hours after online publication and is updated daily on week days.
Initial download of the metrics may take a while.