Free Access
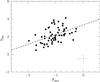
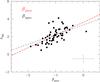
Fig. 11

AIRX vs. β for IR-detected galaxies in the UV sample. Top: β is measured from the spectra. The black line is a fit to the data (Eq. (6)). Bottom: β is measured from photometry. The red line is a fit to the data (Eq. (7)). The black line is the relation for βspec.
This figure is made of several images, please see below:
Current usage metrics show cumulative count of Article Views (full-text article views including HTML views, PDF and ePub downloads, according to the available data) and Abstracts Views on Vision4Press platform.
Data correspond to usage on the plateform after 2015. The current usage metrics is available 48-96 hours after online publication and is updated daily on week days.
Initial download of the metrics may take a while.