Fig. 10
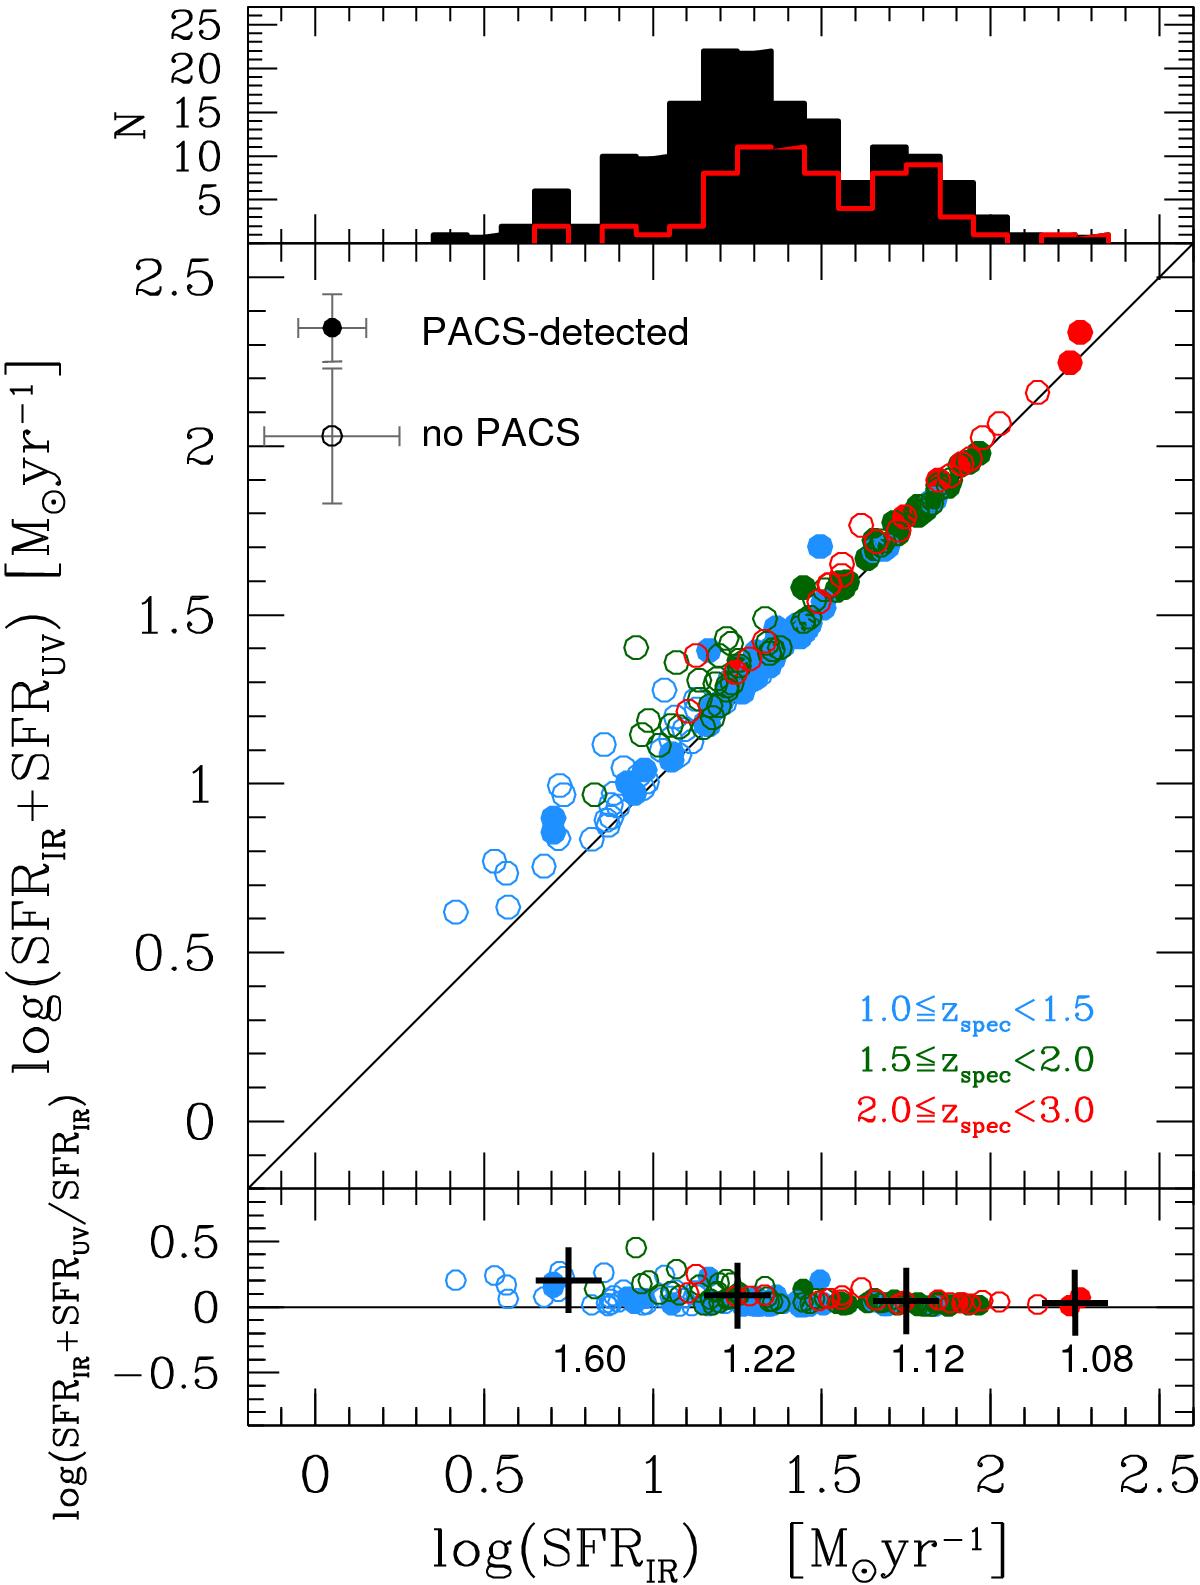
Main plot: comparison between SFRIR + UV and SFRIR for SFGs with at least one IR detection. Filled points mark PACS-detected galaxies. Bottom plot: SFRIR + UV over SFRIR ratio as a function of SFRIR. Median ratio in bins of SFRIR are also shown. Upper plot: black histogram is the distribution of SFRIR over the entire sample of SFGs; red empty histogram is the distribution of PACS-detected sources only.
Current usage metrics show cumulative count of Article Views (full-text article views including HTML views, PDF and ePub downloads, according to the available data) and Abstracts Views on Vision4Press platform.
Data correspond to usage on the plateform after 2015. The current usage metrics is available 48-96 hours after online publication and is updated daily on week days.
Initial download of the metrics may take a while.