Free Access
Fig. 2
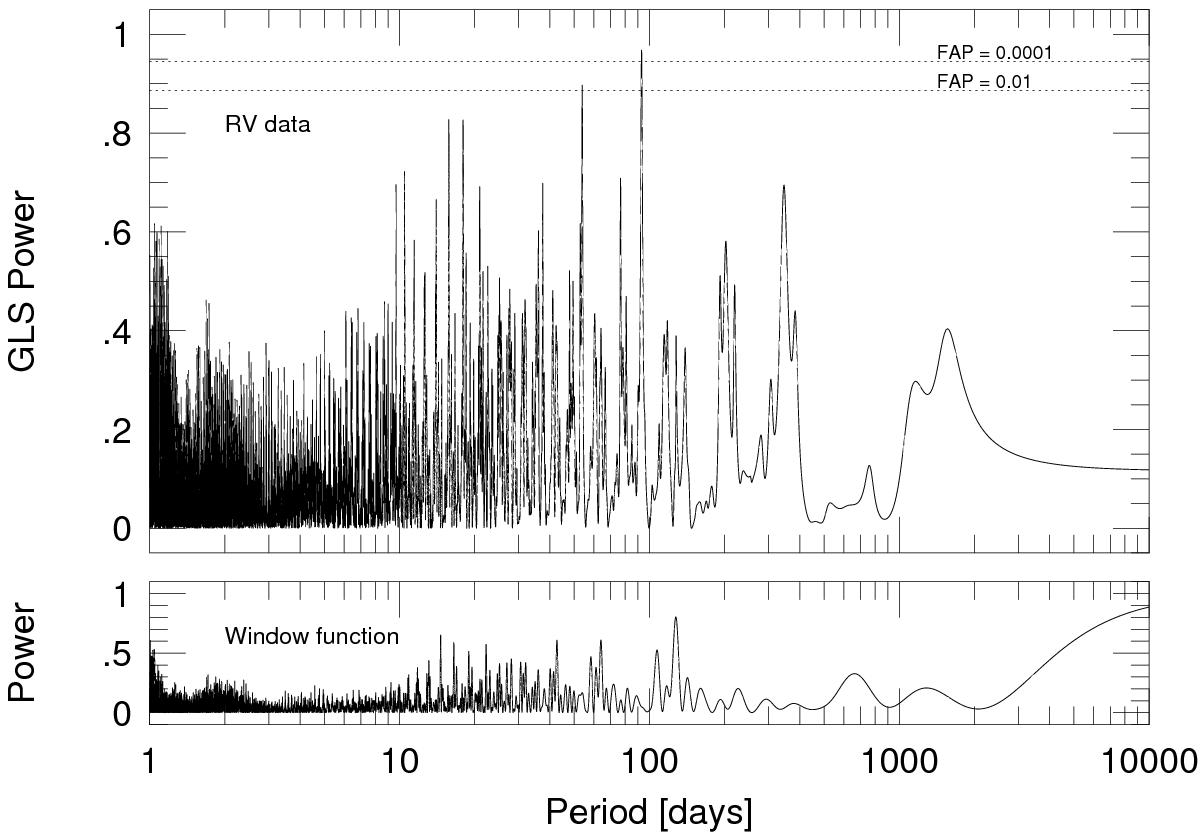
Generalized Lomb-Scargle (GLS) periodogram of the RV data of HD 42659 (top panel). The highest peak is visible at a period of 93.04 days. The dotted lines indicate two levels of the false alarm probability (FAP). The bottom panel displays the window function of our observations.
Current usage metrics show cumulative count of Article Views (full-text article views including HTML views, PDF and ePub downloads, according to the available data) and Abstracts Views on Vision4Press platform.
Data correspond to usage on the plateform after 2015. The current usage metrics is available 48-96 hours after online publication and is updated daily on week days.
Initial download of the metrics may take a while.