Fig. 9
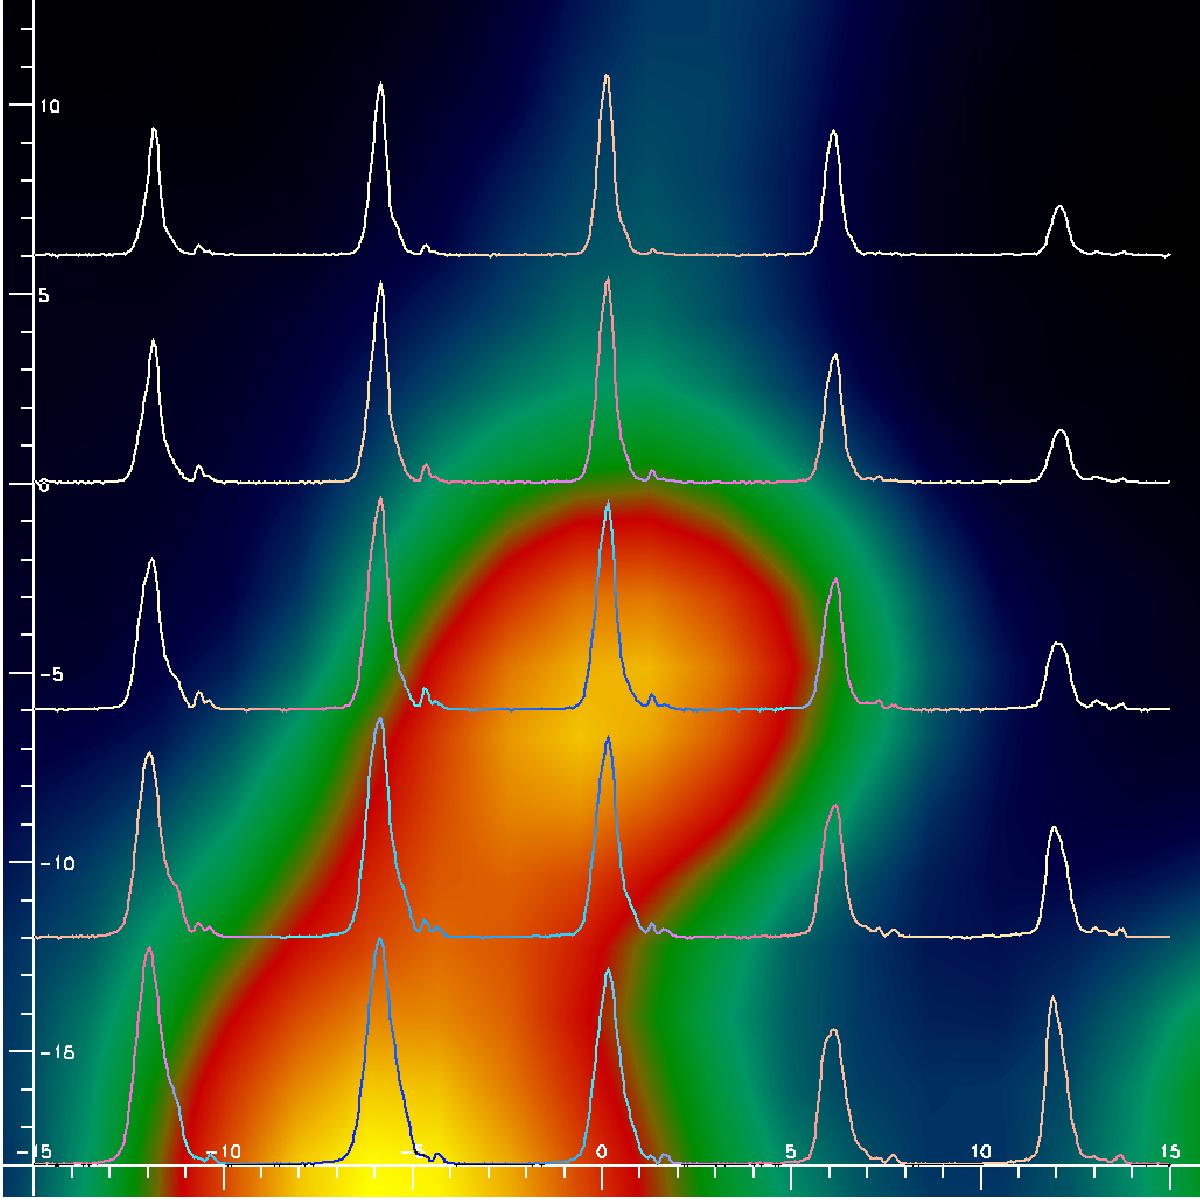
APEX CO(3–2) (345 GHz) spectra in a grid of 25 positions (6′′ spacing) in a region of MM2 centered on IRS 9A (source S9 ). North is up and east to the left, and coordinates are in arcseconds relative to Sa . The individual spectra, each covering 60 km s-1, are displayed over the SABOCA map, with the center and base of each line aligned with the corresponding pointing position. The maximum line peak is 28 K main beam temperature. The beam FWHM is 20′′.
Current usage metrics show cumulative count of Article Views (full-text article views including HTML views, PDF and ePub downloads, according to the available data) and Abstracts Views on Vision4Press platform.
Data correspond to usage on the plateform after 2015. The current usage metrics is available 48-96 hours after online publication and is updated daily on week days.
Initial download of the metrics may take a while.