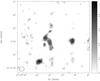
Fig. 2
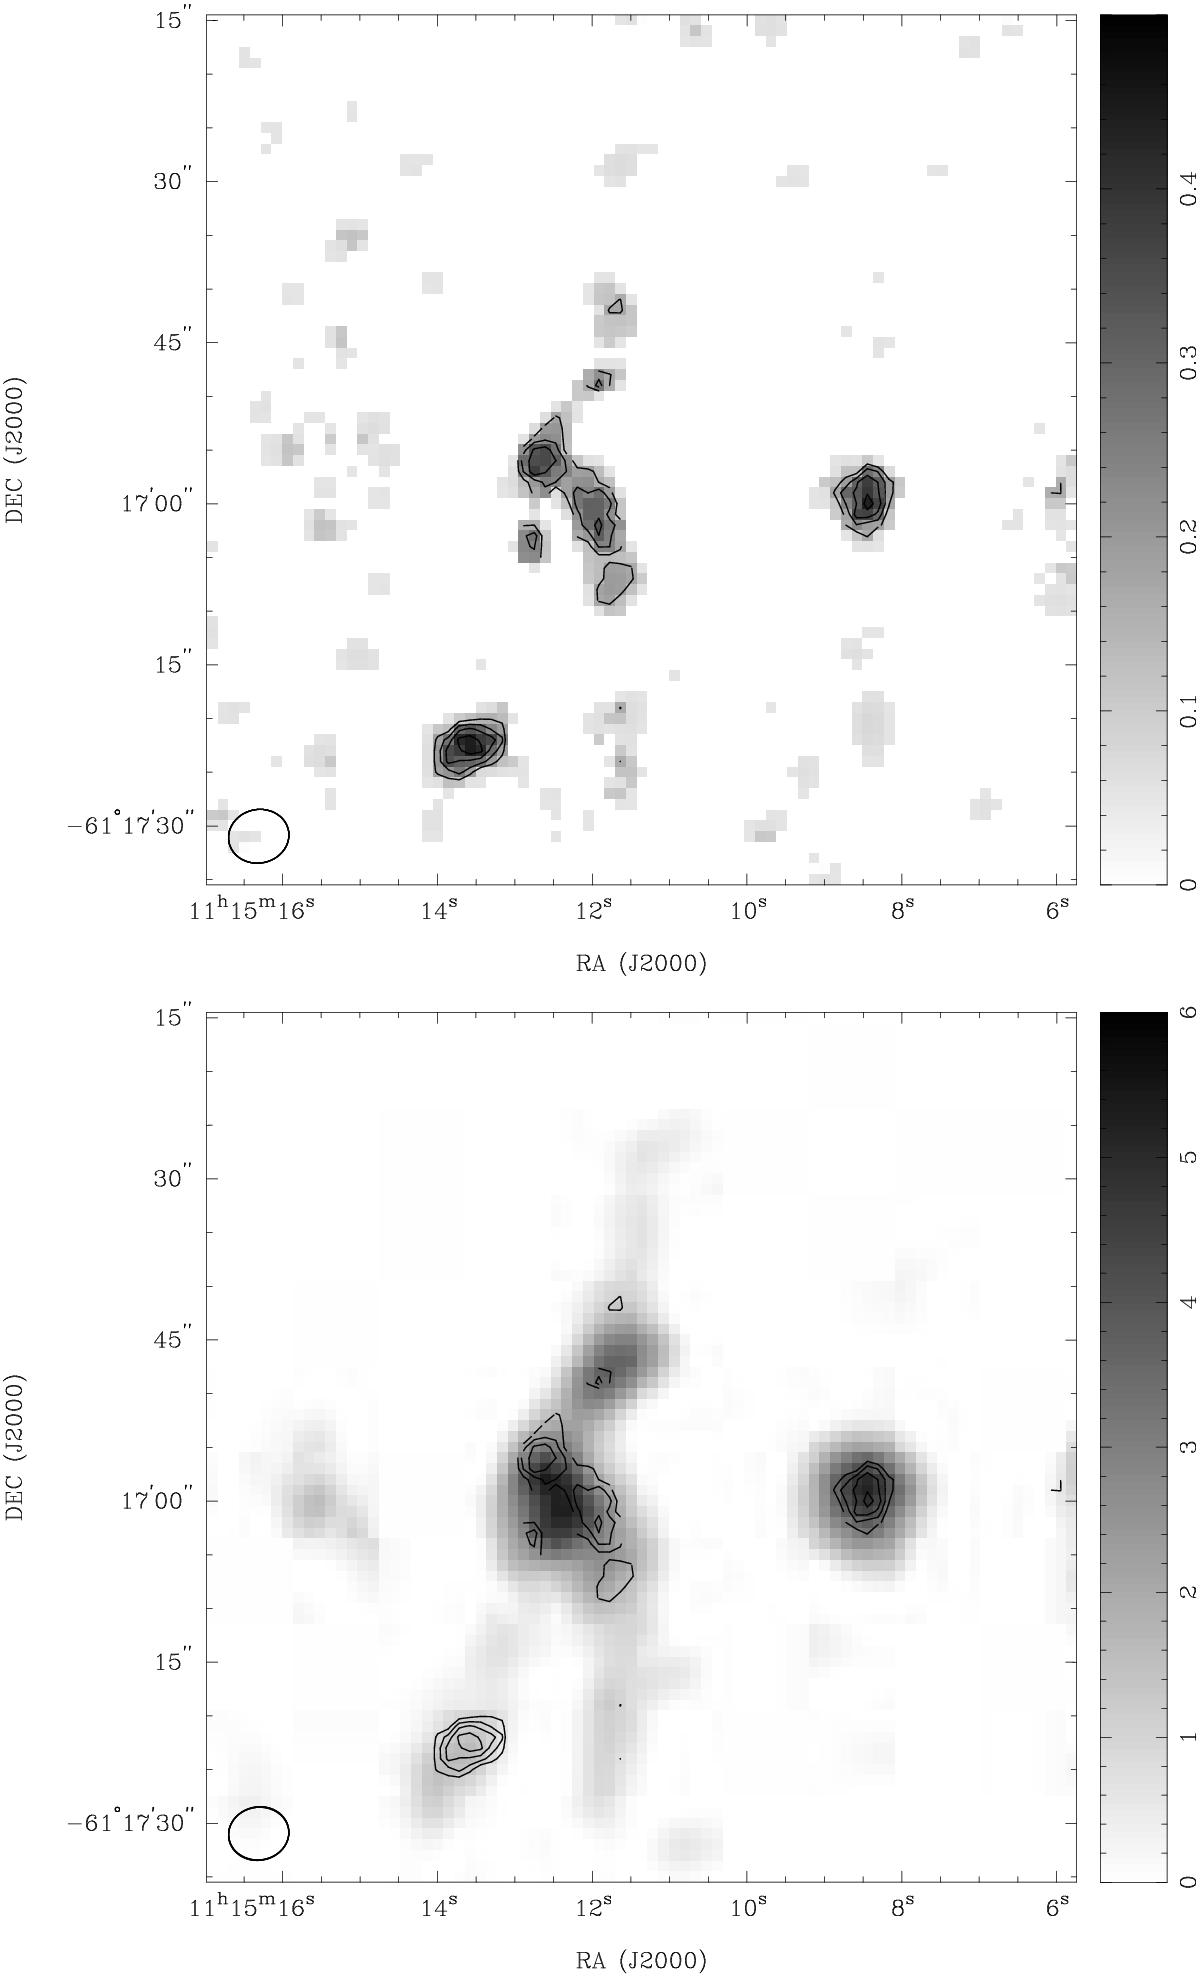
ATCA C34S(2–1) molecular line emission in NGC 3603 MM2. Top: integrated intensity map; the contour levels are 0.16, 0.24, 0.32, and 0.40 Jy beam-1 km s-1. Bottom: C34S(2–1) contours overlaid onto CS(2–1) emission map. The synthesized beam (5.6′′ × 4.9′′) is displayed in the bottom left of each panel, and the gray-scale wedge for data values on the right of each panel.
Current usage metrics show cumulative count of Article Views (full-text article views including HTML views, PDF and ePub downloads, according to the available data) and Abstracts Views on Vision4Press platform.
Data correspond to usage on the plateform after 2015. The current usage metrics is available 48-96 hours after online publication and is updated daily on week days.
Initial download of the metrics may take a while.