Free Access
Fig. A.1
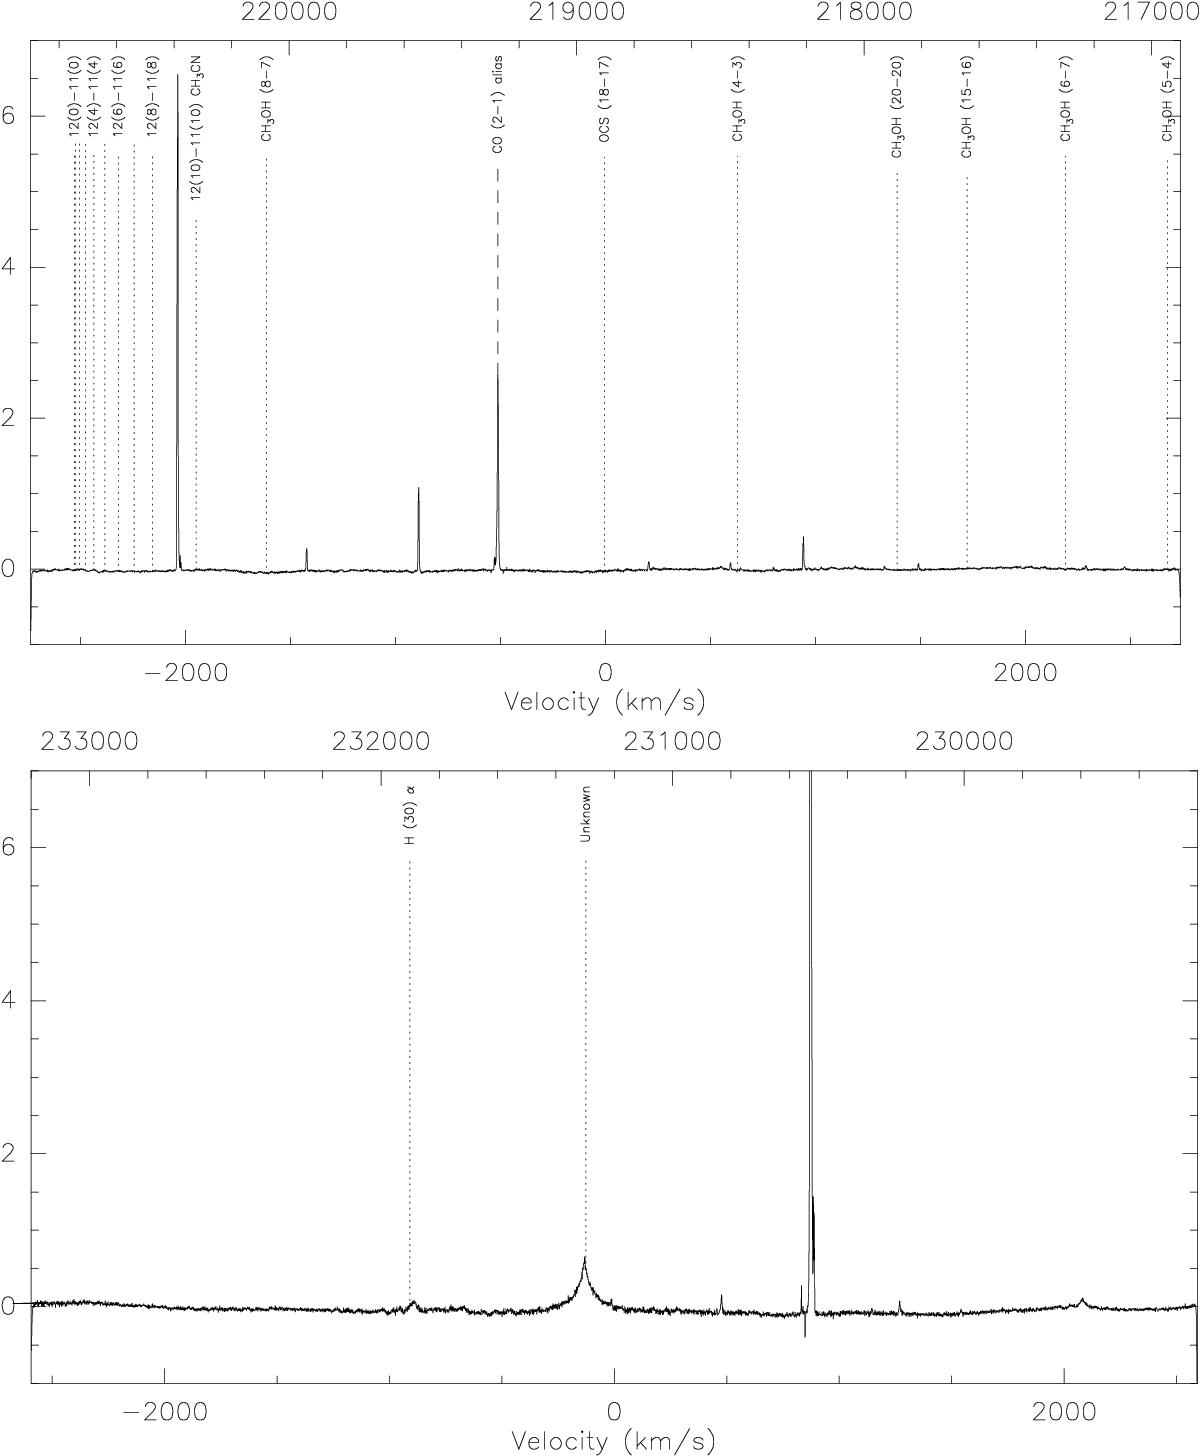
Full-bandwidth spectra for settings 1 and 2 recorded with SHFI on source Sa. All spectra were smoothed with a 10-channel box. The “wiggles” of the baseline in the lower left panel are due to instrumental problems. Dotted lines mark frequencies of molecular lines that we expected to see, but did not.
This figure is made of several images, please see below:
Current usage metrics show cumulative count of Article Views (full-text article views including HTML views, PDF and ePub downloads, according to the available data) and Abstracts Views on Vision4Press platform.
Data correspond to usage on the plateform after 2015. The current usage metrics is available 48-96 hours after online publication and is updated daily on week days.
Initial download of the metrics may take a while.