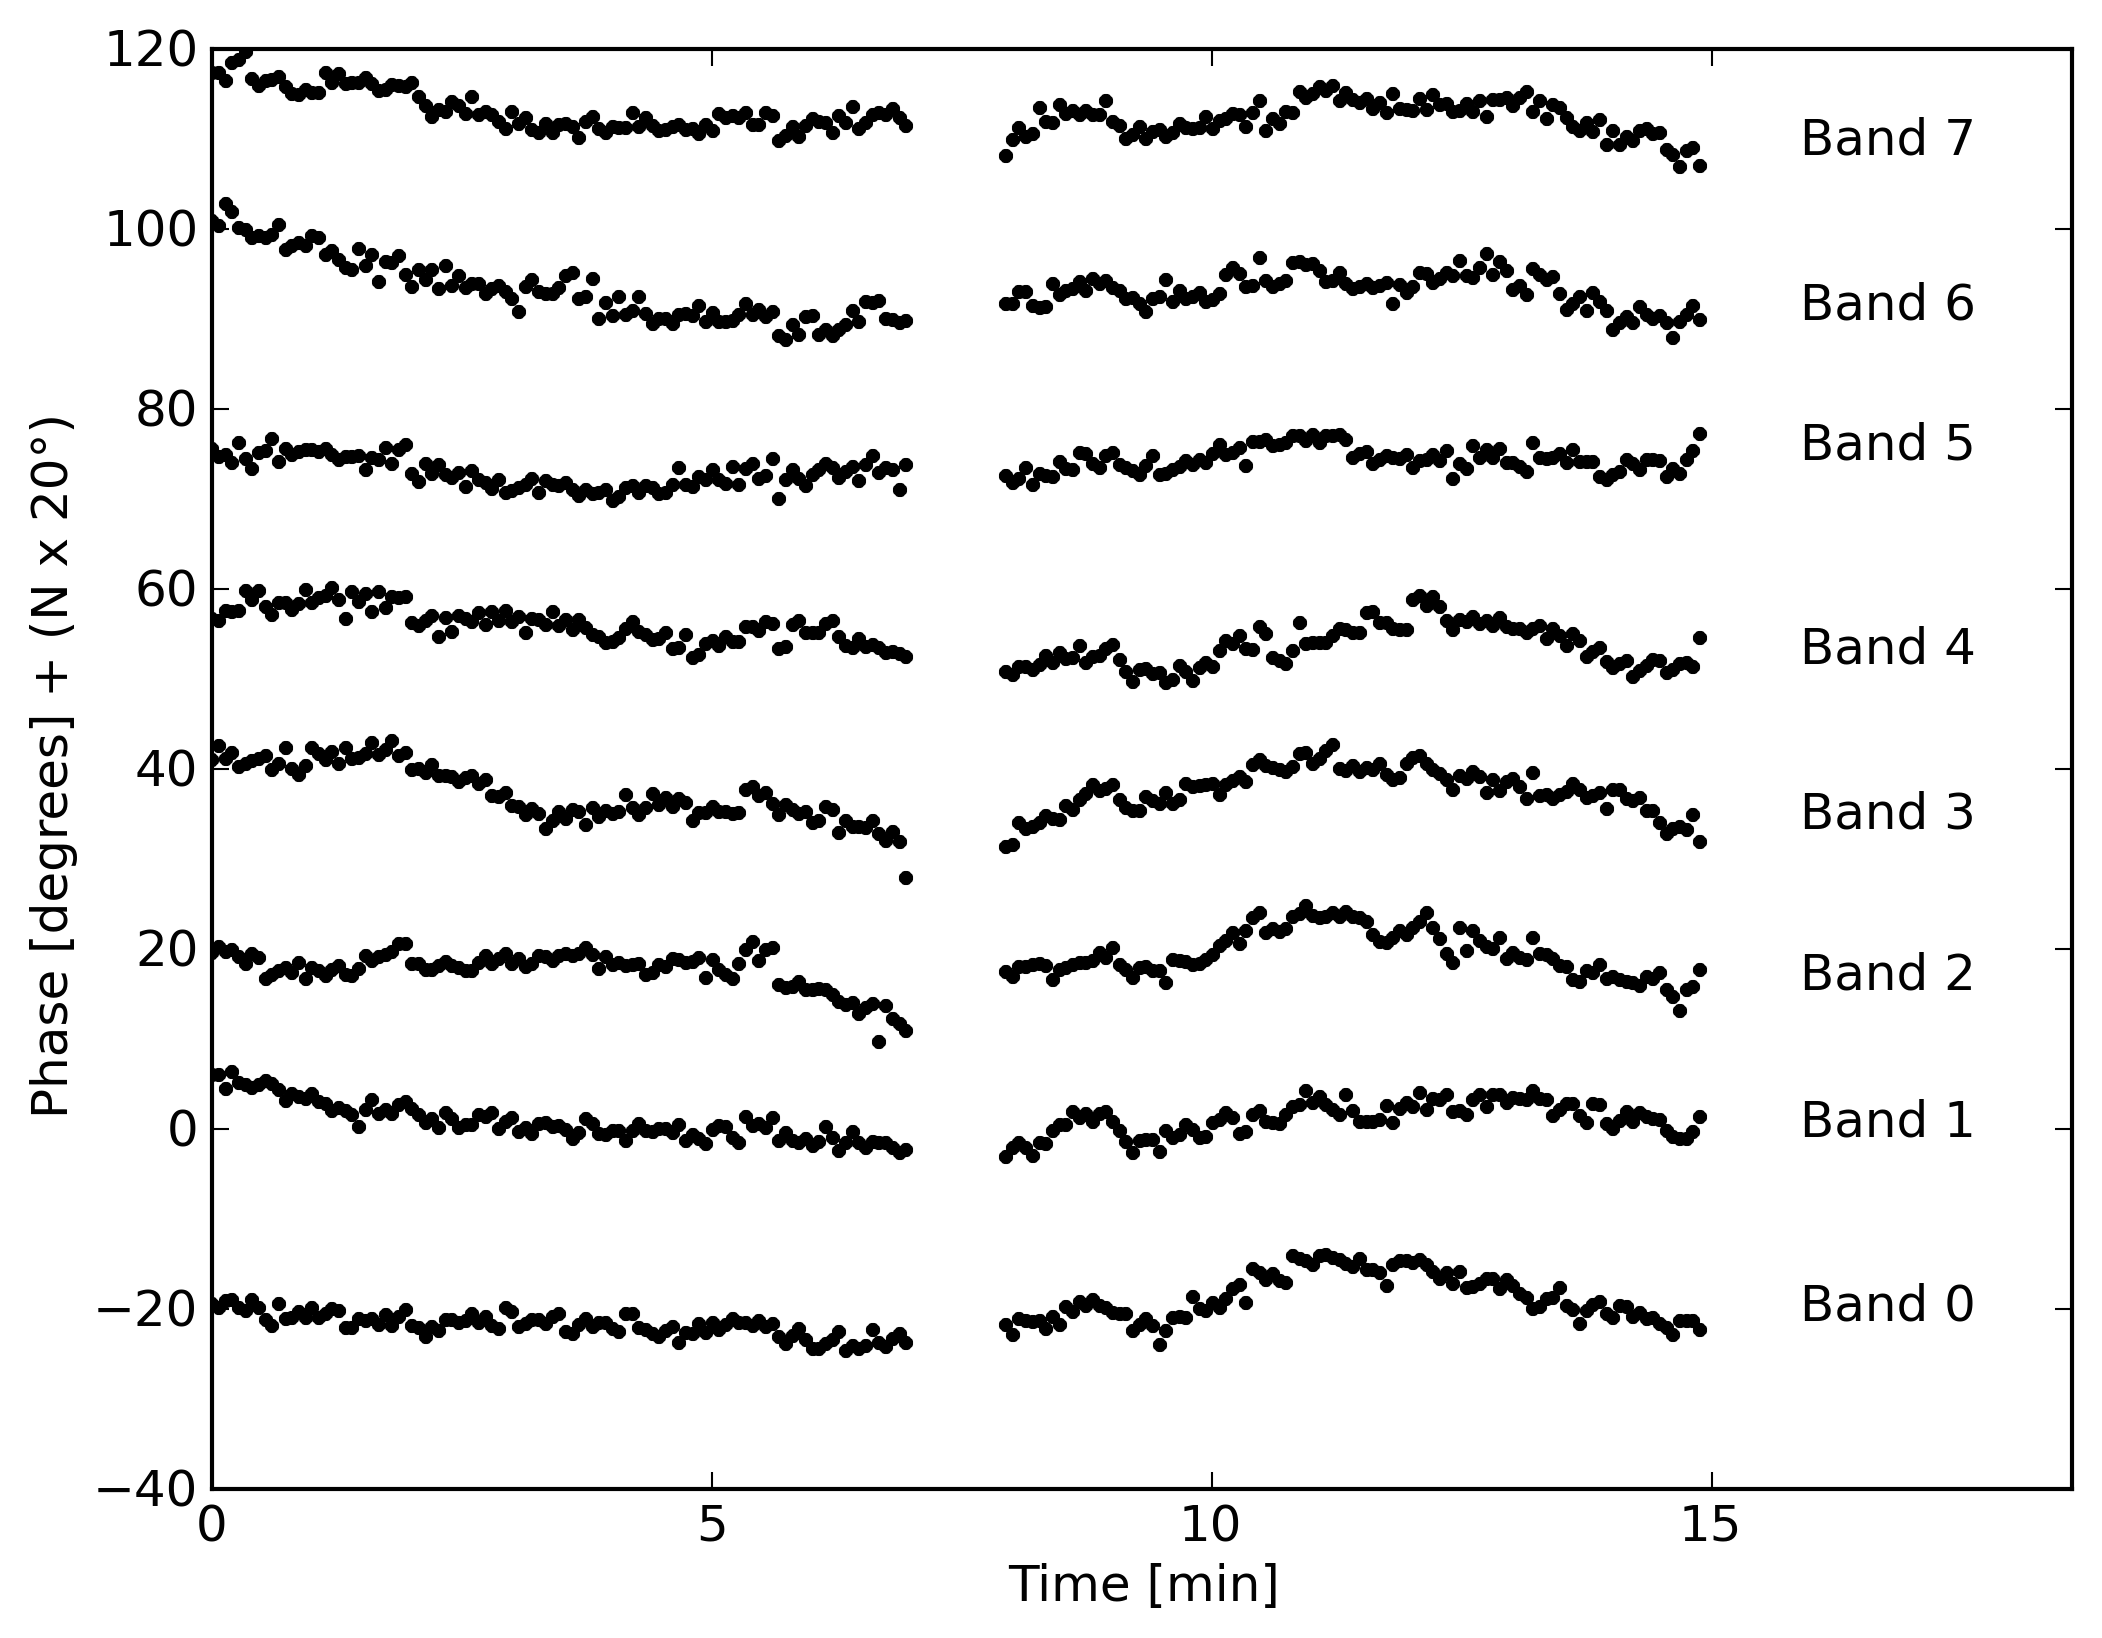
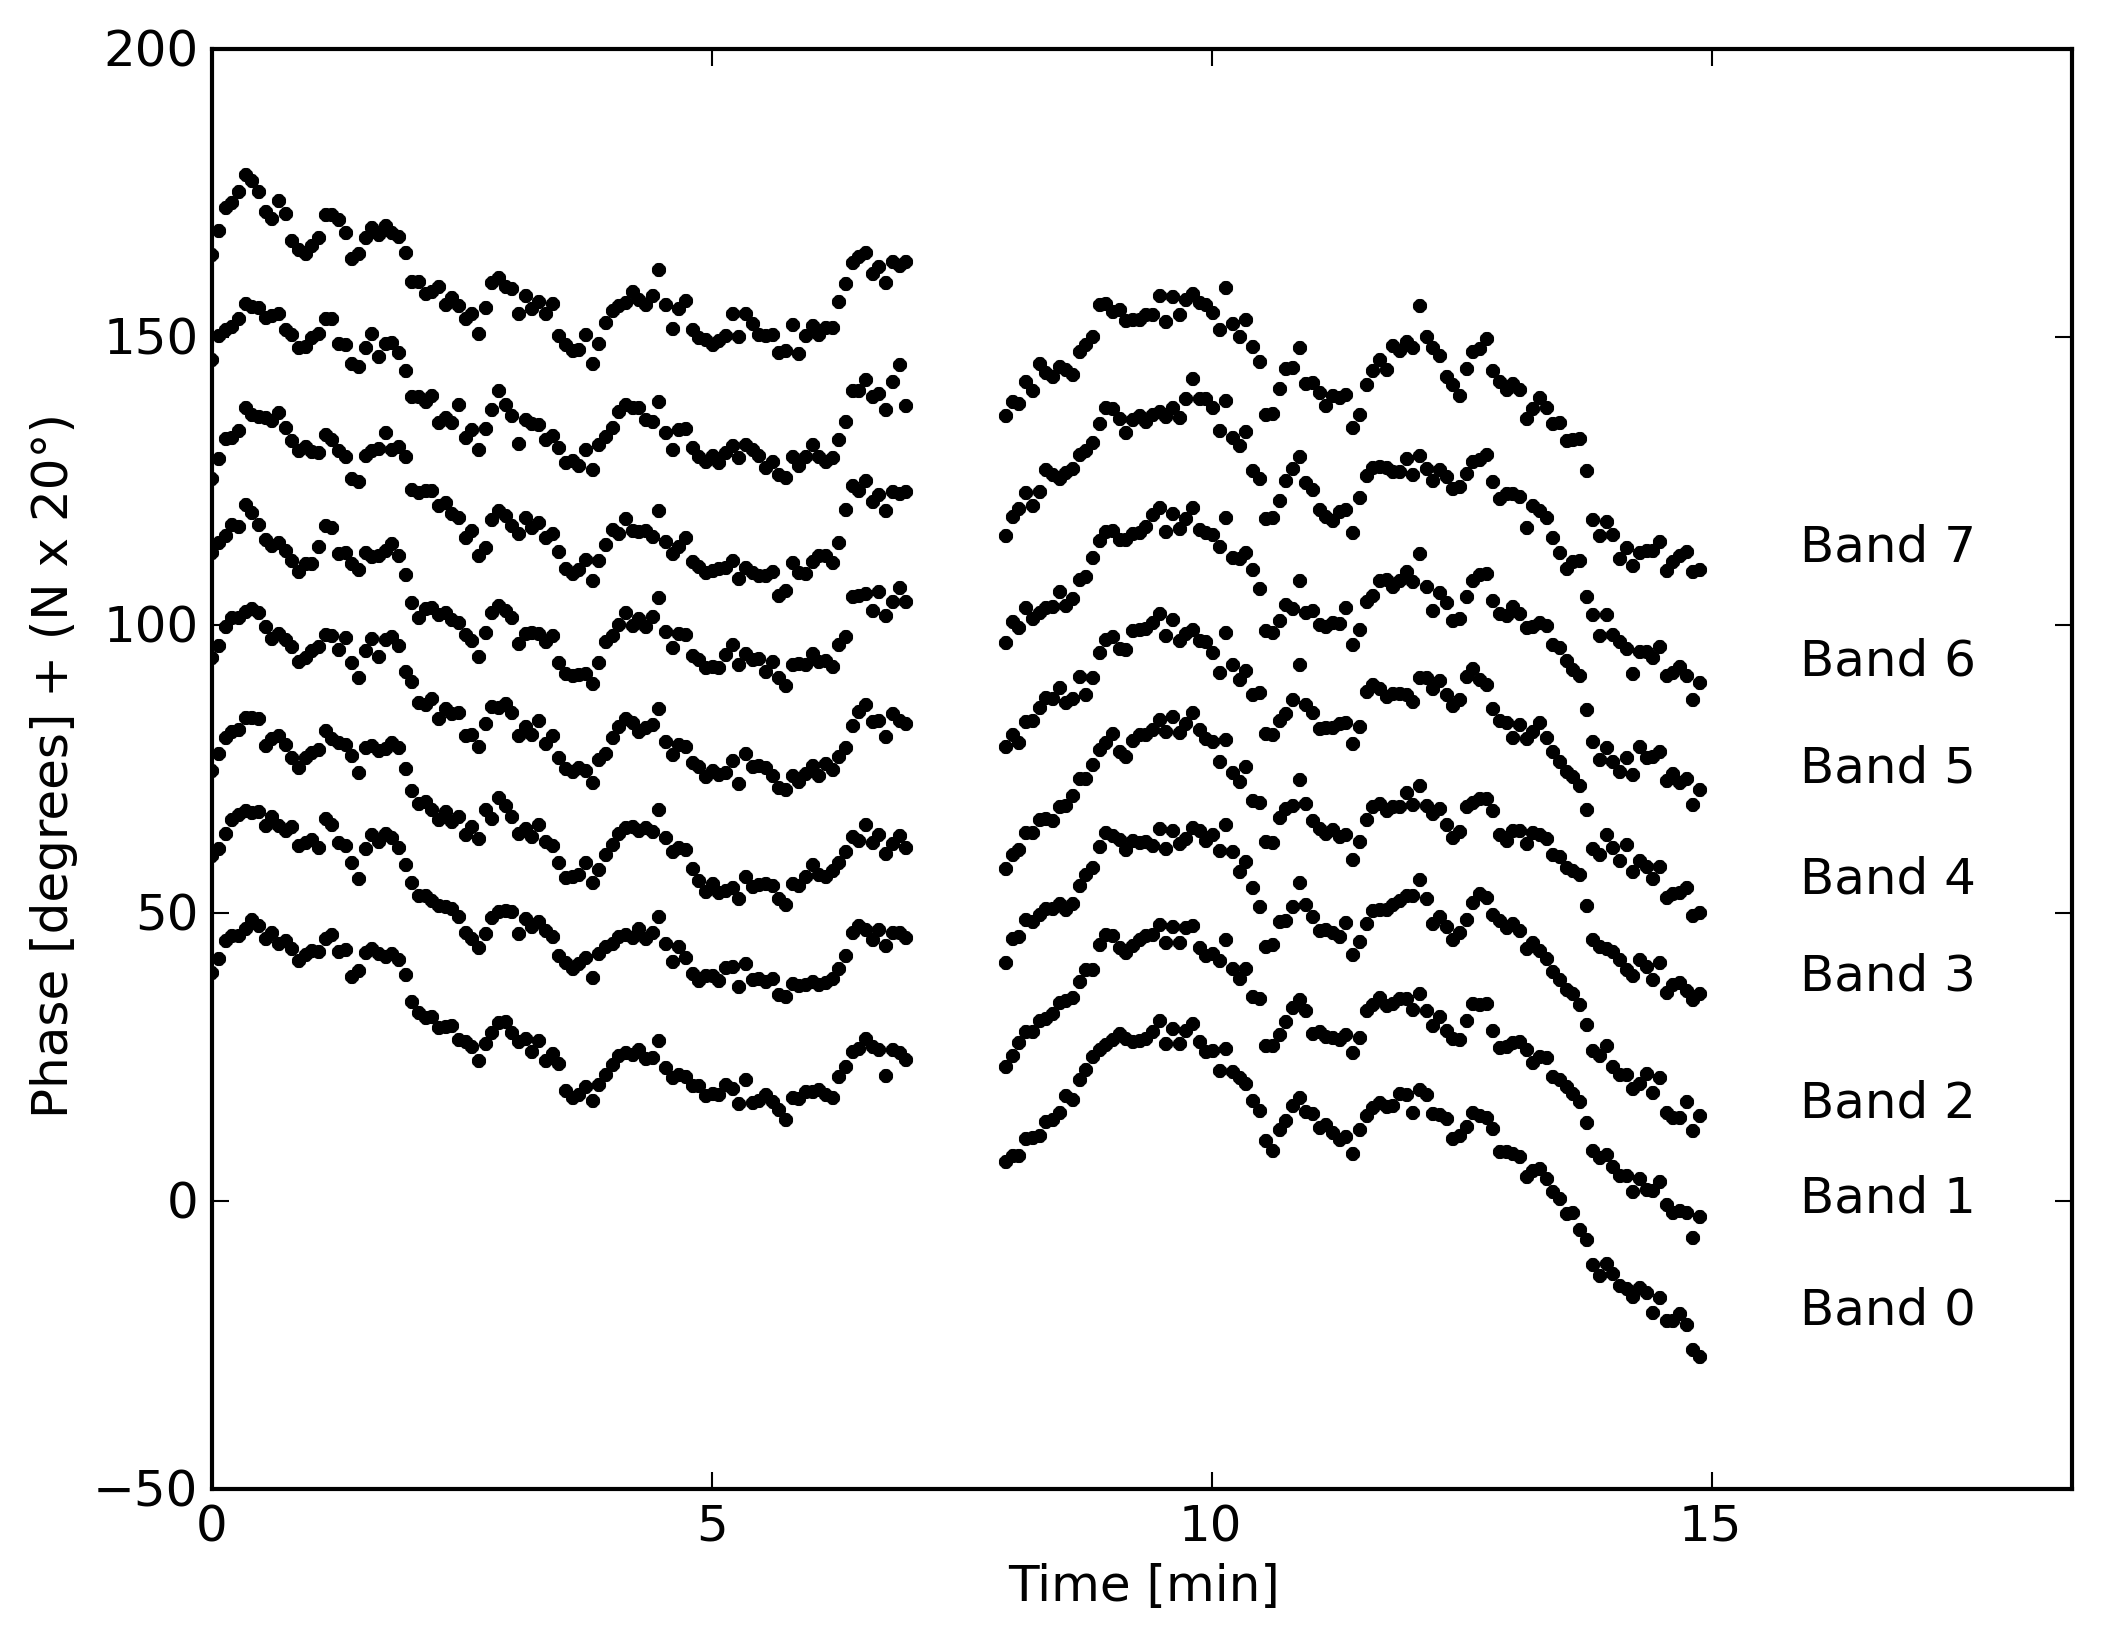
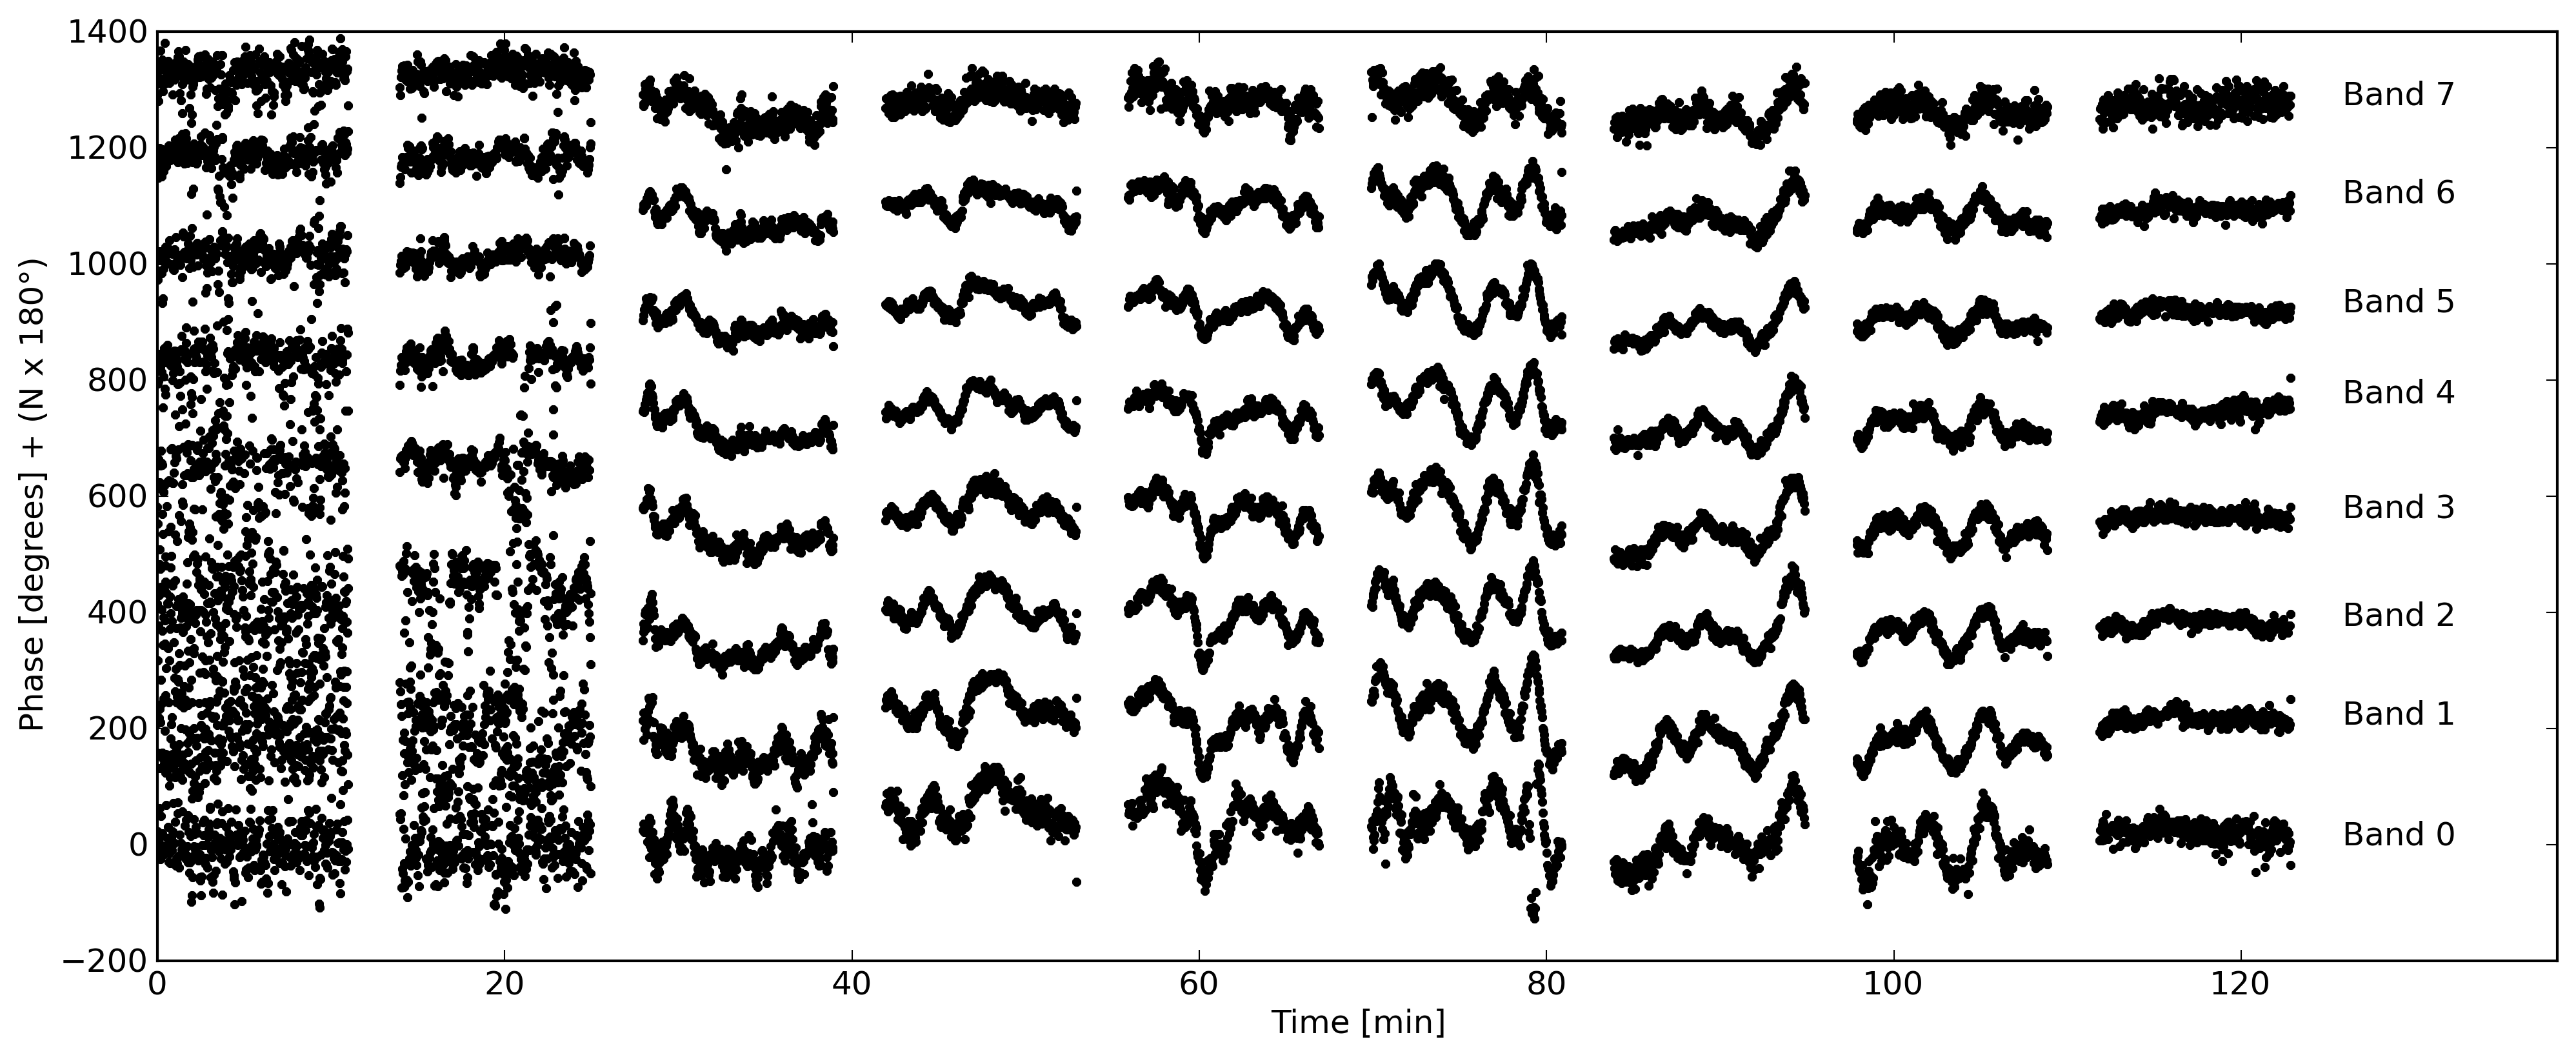
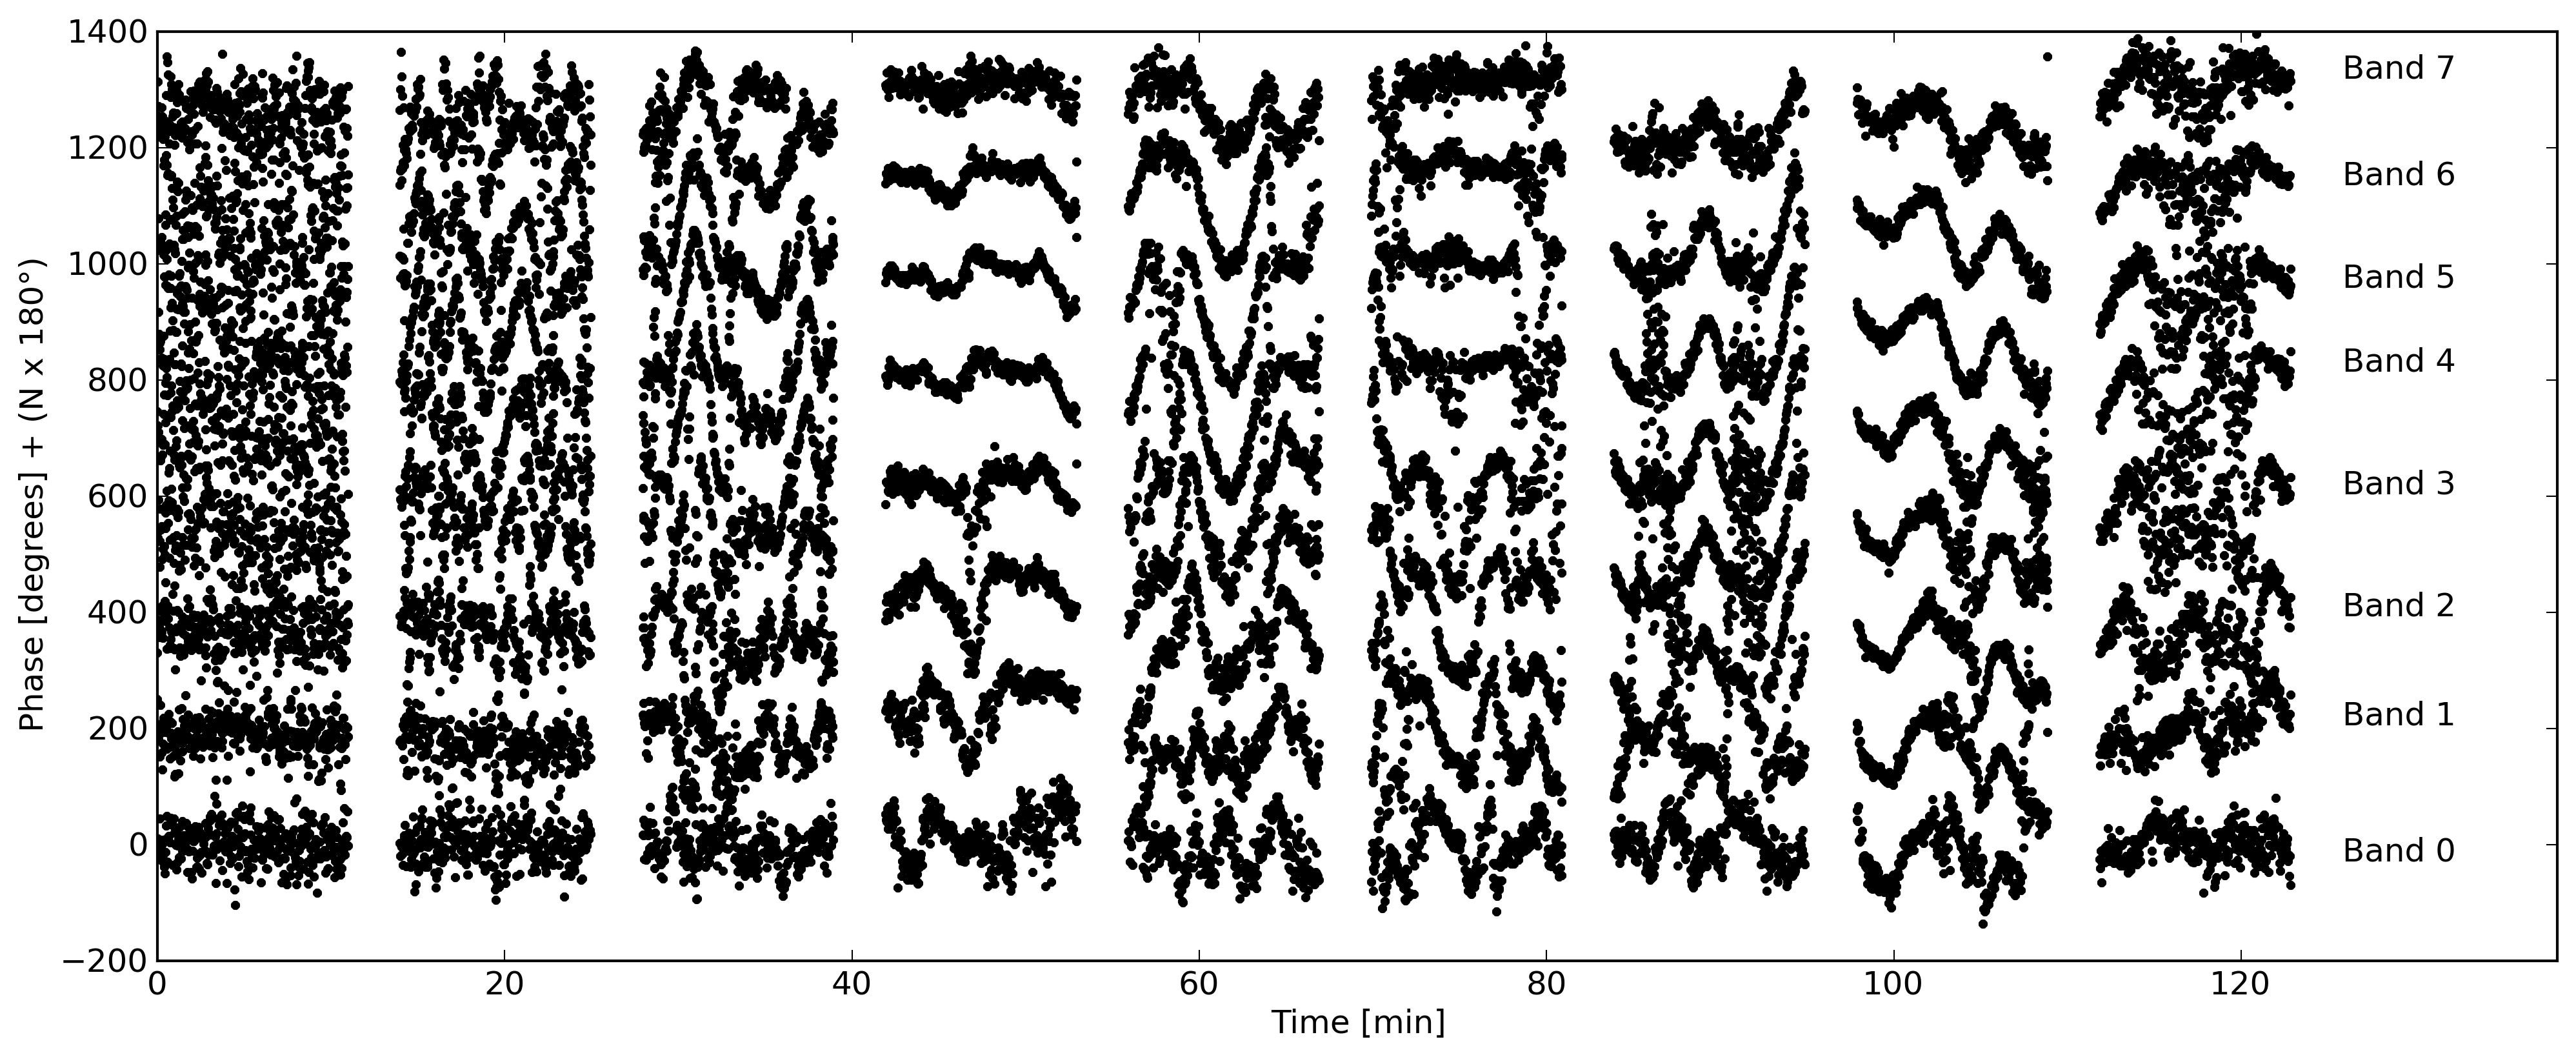
Fig. 8
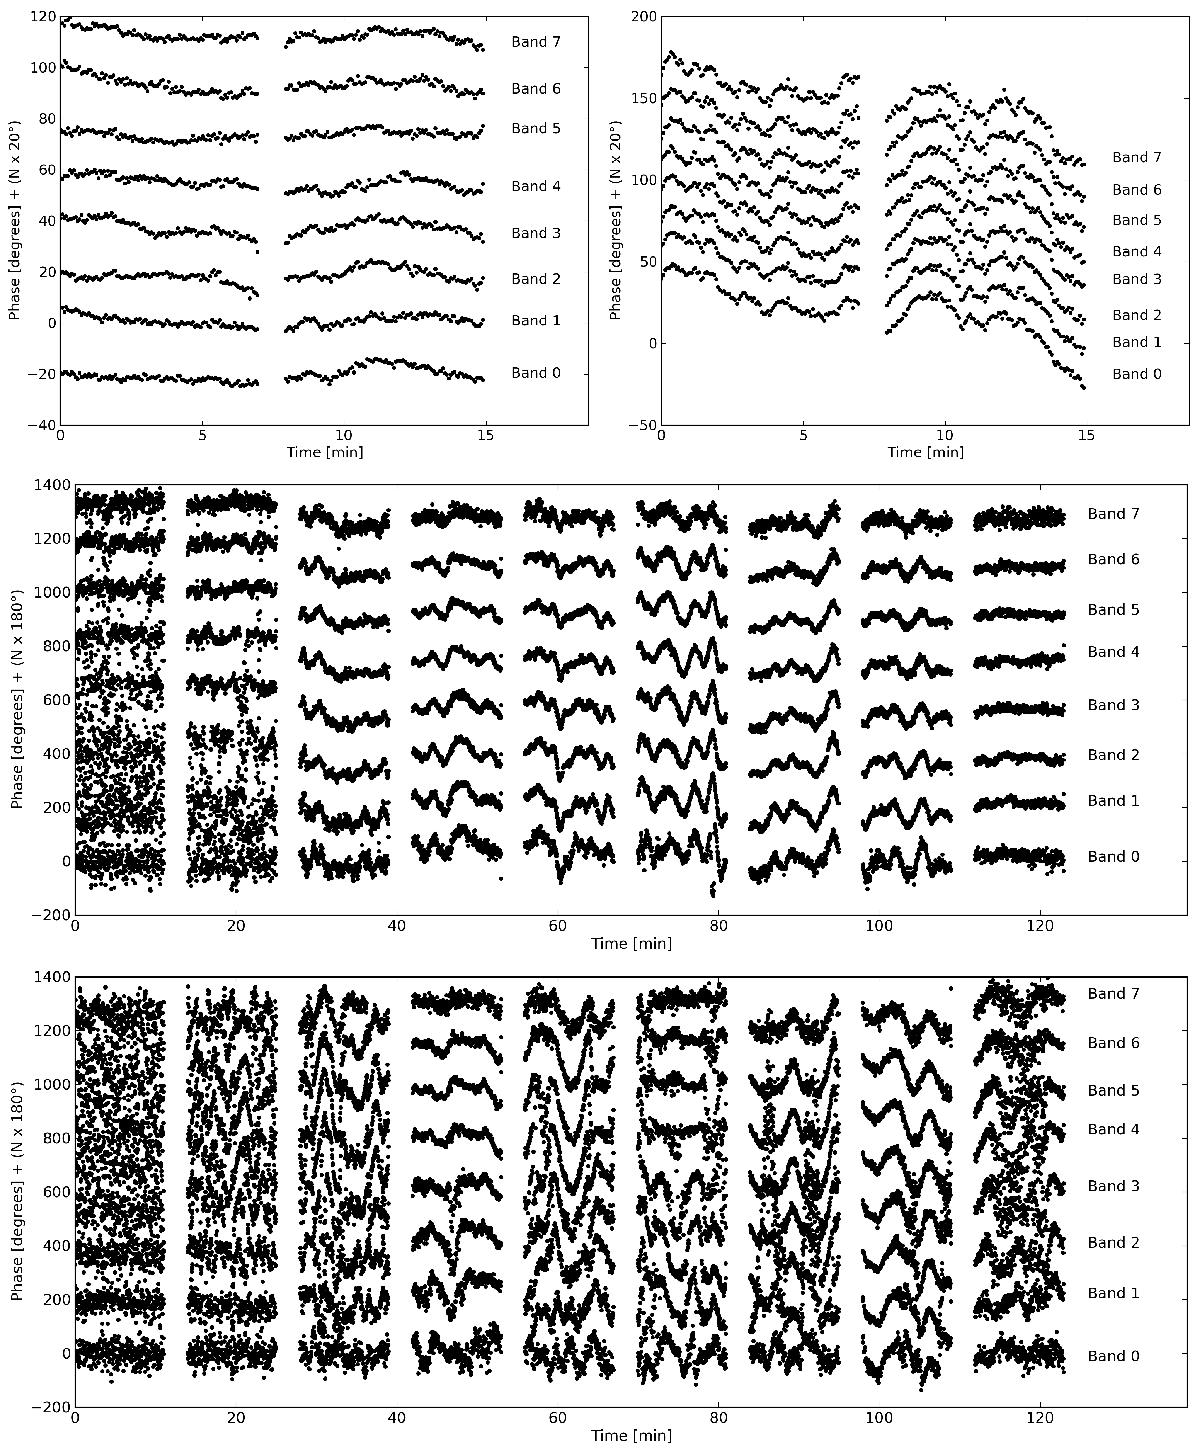
Gain phases determined by the TIP (see Sect. 3.4) for observations of the HBA and LBA fields H229+70 and L227+69 (see Table 3). Gain phases are displayed for HBA (top row of panels) and LBA (bottom two panels), referenced to CS002HBA0 and CS002LBA, respectively. (CS002 is one of the six superterp stations.) The phases are shifted vertically for display purposes. They correspond to the (0, 0) element of the station gain matrix for CS302 (top left and middle) and RS306 (top right and bottom). The gaps between snapshots are compressed for display purposes, and correspond to 4 h for HBA and 45 min for LBA.
Current usage metrics show cumulative count of Article Views (full-text article views including HTML views, PDF and ePub downloads, according to the available data) and Abstracts Views on Vision4Press platform.
Data correspond to usage on the plateform after 2015. The current usage metrics is available 48-96 hours after online publication and is updated daily on week days.
Initial download of the metrics may take a while.