Fig. 18
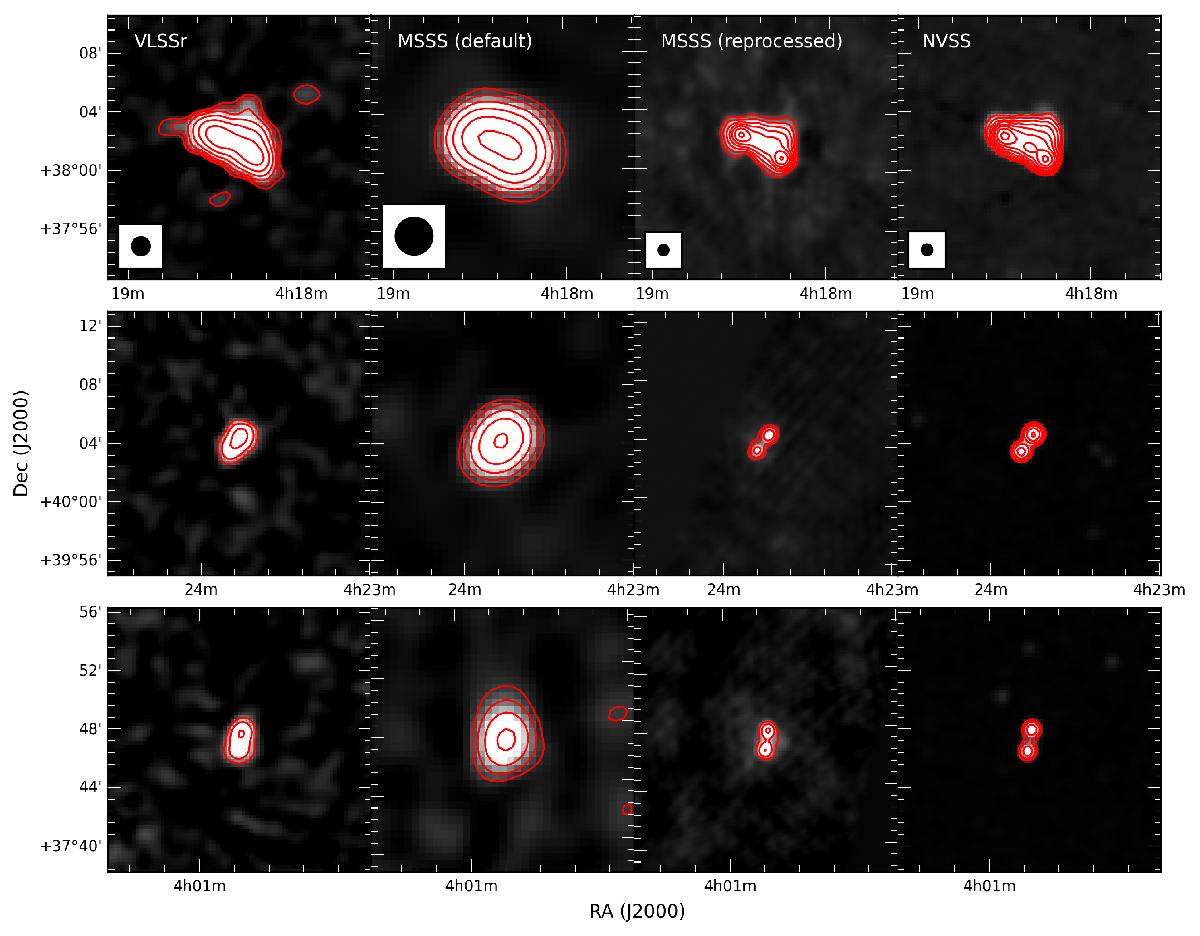
Images of three sources, one per row, identified in the field of H063+39. The sources are 3C 111 (top), 4C +39.13 (middle), and 4C +37.10 (bottom). In each row the left panel displays the VLSSr image (resolution 75″), the next two columns display MSSS images at 2.5′ and 42″ resolution (see Sect. 6.1), and the right panel displays the NVSS image (resolution 45″). The beamsize for each column is plotted in the top row. Contour levels begin at 0.6 Jy beam-1 for VLSS; 1, 0.2 and 0.2 Jy beam-1 for low-resolution MSSS; 0.2, 0.15 and 0.1 Jy beam-1 for high-resolution MSSS; and 0.02 Jy beam-1 for NVSS. Contours increase by multiples of 2 in all frames.
Current usage metrics show cumulative count of Article Views (full-text article views including HTML views, PDF and ePub downloads, according to the available data) and Abstracts Views on Vision4Press platform.
Data correspond to usage on the plateform after 2015. The current usage metrics is available 48-96 hours after online publication and is updated daily on week days.
Initial download of the metrics may take a while.