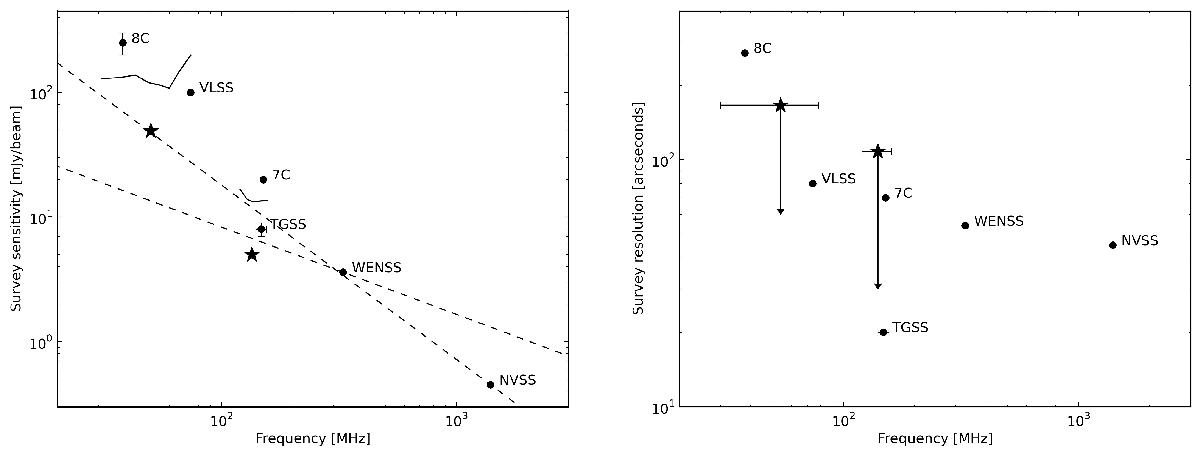
Fig. 17

Comparisons between MSSS sensitivities (left) and resolutions (right) with those of other existing radio surveys as summarized in Table 4. In the lefthand panel, dashed lines indicate representative spectral indices of α = −0.7 and α = −1.4. The solid black lines illustrate the frequency dependence of the sensitivity in the 8 bands in each of the LBA and HBA survey segments, while the black stars show the frequency-averaged sensitivity demonstrated in Sect. 5. In the righthand panel, the downward-pointing arrows indicate that the angular resolution of the initial MSSS catalog is limited with respect to the capabilities of the visibility data. Processing the full array will improve the survey performance.
Current usage metrics show cumulative count of Article Views (full-text article views including HTML views, PDF and ePub downloads, according to the available data) and Abstracts Views on Vision4Press platform.
Data correspond to usage on the plateform after 2015. The current usage metrics is available 48-96 hours after online publication and is updated daily on week days.
Initial download of the metrics may take a while.


