Free Access
Fig. 13
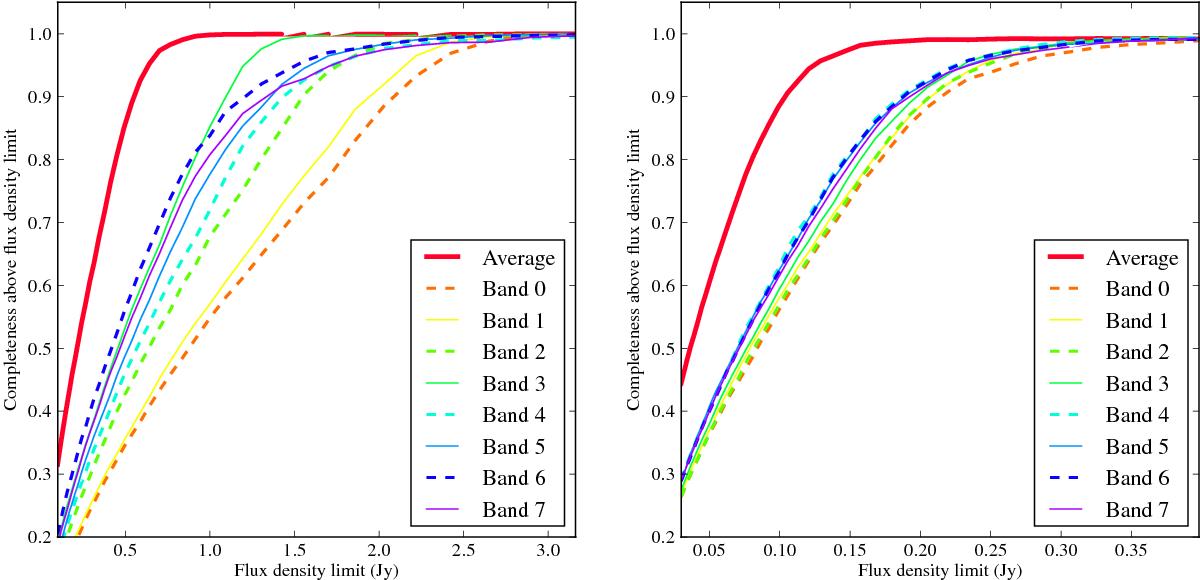
Results of completeness simulations for LBA (left) and HBA (right). Curves show the cumulative completeness for the individual frequencies in the LBA and HBA and for their combination at a nominal reference frequency of 50 and 135 MHz, respectively.
This figure is made of several images, please see below:
Current usage metrics show cumulative count of Article Views (full-text article views including HTML views, PDF and ePub downloads, according to the available data) and Abstracts Views on Vision4Press platform.
Data correspond to usage on the plateform after 2015. The current usage metrics is available 48-96 hours after online publication and is updated daily on week days.
Initial download of the metrics may take a while.