Fig. 2
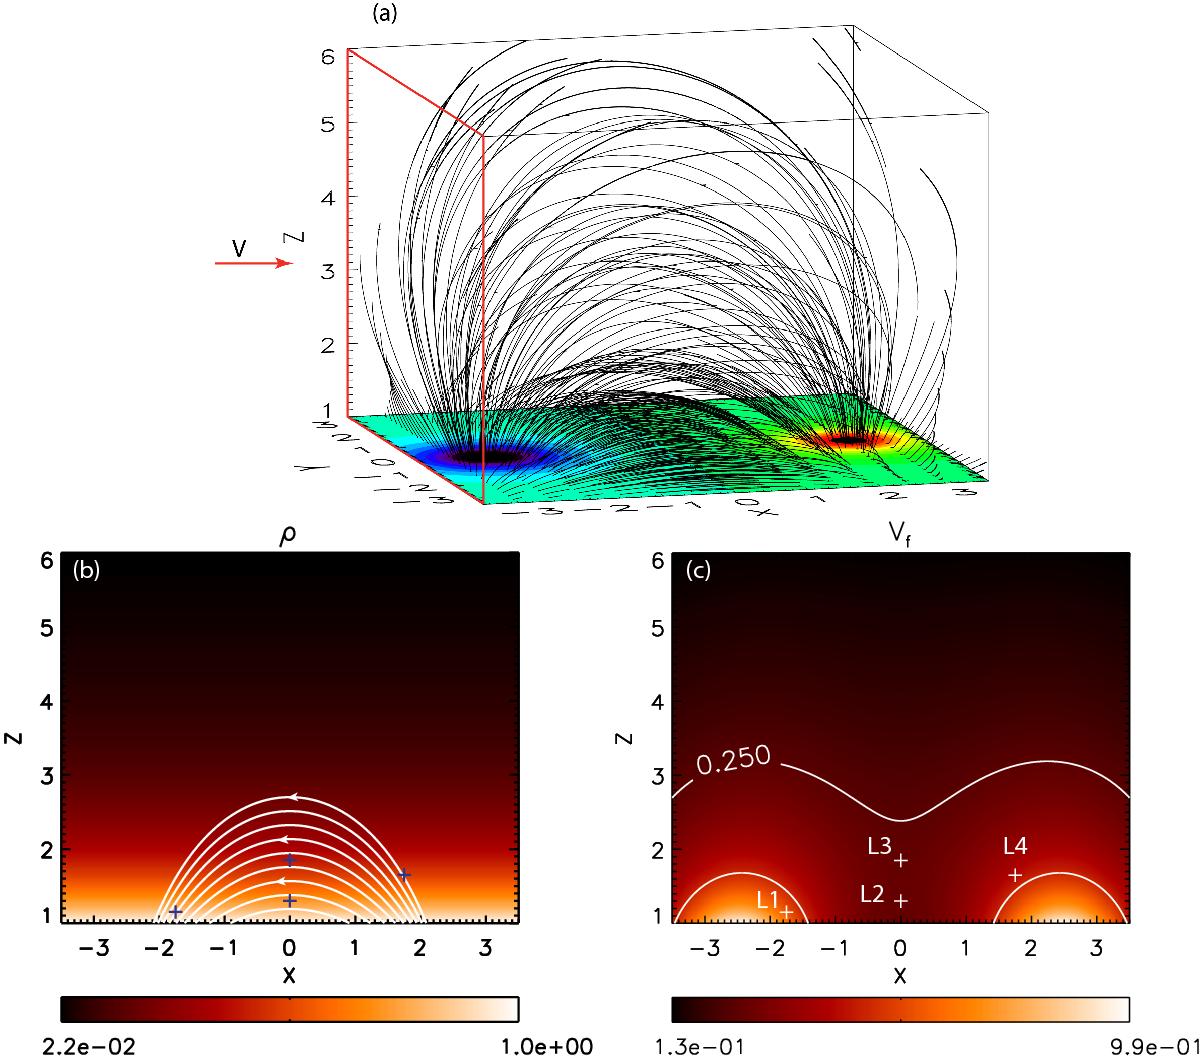
a) Idealized model of the AR as a magnetic dipole. The red box shows the yz boundary plane at x = 0 impacted by the propagating disturbance that models the effect of the flare on the active region curtain. The red arrow shows the direction of the impacting velocity pulse applied as the time-dependent boundary condition on this plane. The orientation of the model is turned by 90° CCW with respect to the observation shown in Fig. 1. Bottom: normalized initial density distribution overlayed with some of the closed field lines that belong to the curtain are shown (b) and initial fast magnetosonic speed (c) in the xz plane at y = 0. The blue (white) “+” symbols mark the locations of the points L1−L4 used for temporal evolution diagnostic (see below).
Current usage metrics show cumulative count of Article Views (full-text article views including HTML views, PDF and ePub downloads, according to the available data) and Abstracts Views on Vision4Press platform.
Data correspond to usage on the plateform after 2015. The current usage metrics is available 48-96 hours after online publication and is updated daily on week days.
Initial download of the metrics may take a while.