Fig. 1
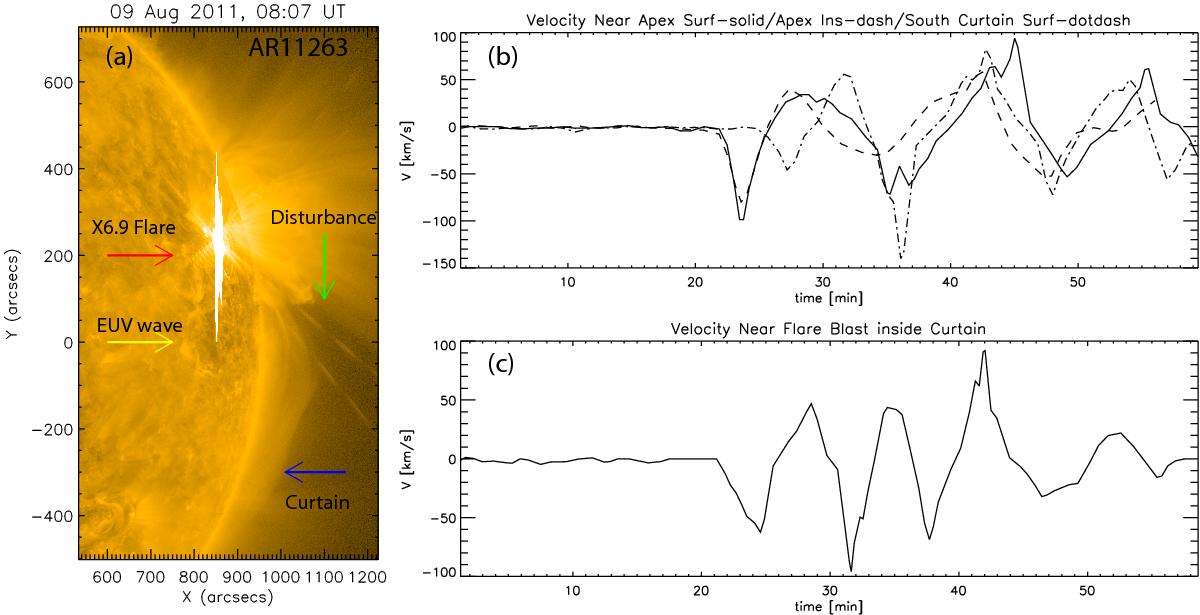
a) Snapshot from 9 August 2011 at 08:07 illustrates the X 6.9 flare (red arrow), EUV wave (yellow arrow), plasma curtain (blue arrow), and disturbances passing in a narrow channel above it (green arrow) (adapted from SG13). The temporal evolution of is available as a movie in the online edition. b) Temporal evolution of the velocity in various parts of the plasma curtain as observed by SG13. c) Temporal evolution of the velocity near the flare site.
Current usage metrics show cumulative count of Article Views (full-text article views including HTML views, PDF and ePub downloads, according to the available data) and Abstracts Views on Vision4Press platform.
Data correspond to usage on the plateform after 2015. The current usage metrics is available 48-96 hours after online publication and is updated daily on week days.
Initial download of the metrics may take a while.