Fig. 8
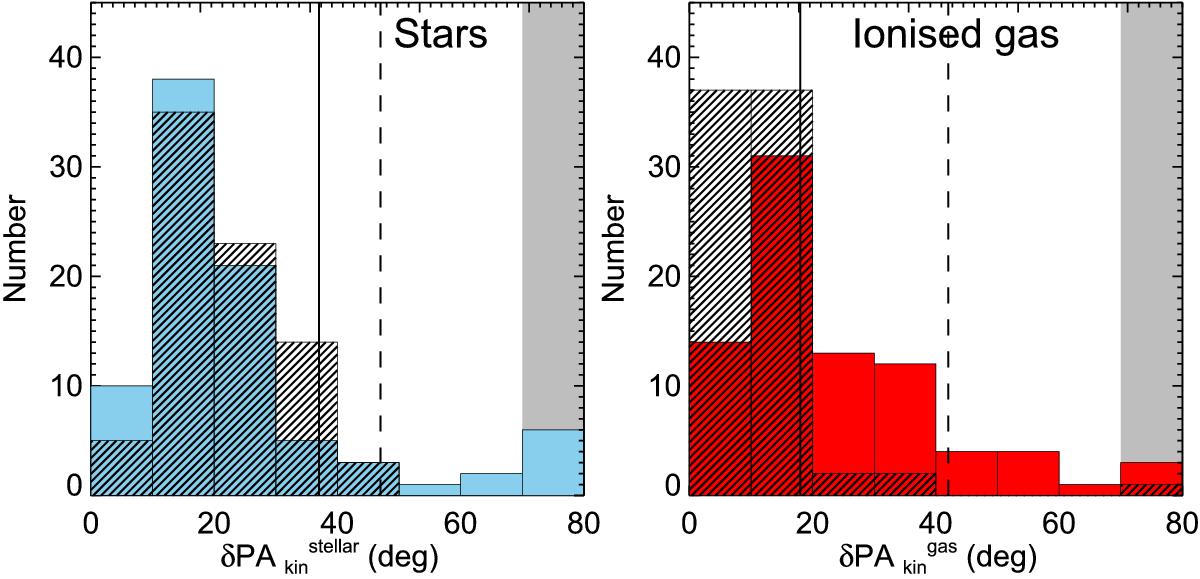
Distribution of the deviation of the kinematic PA from a straight line (δPAkin) for the stellar (left, blue histogram) and the ionized gas components (right, red histogram). Similar to Figs. 4 and 6, in each plot line-filled histograms represent the distribution of δPAkin for the control sample. Solid lines represent the misalignment which includes 90% of the control sample. Dashed lines represent the same value for the interacting galaxies. The bins located in the gray areas represent those galaxies where is not possible to determine δPAkin.
Current usage metrics show cumulative count of Article Views (full-text article views including HTML views, PDF and ePub downloads, according to the available data) and Abstracts Views on Vision4Press platform.
Data correspond to usage on the plateform after 2015. The current usage metrics is available 48-96 hours after online publication and is updated daily on week days.
Initial download of the metrics may take a while.