Fig. 5
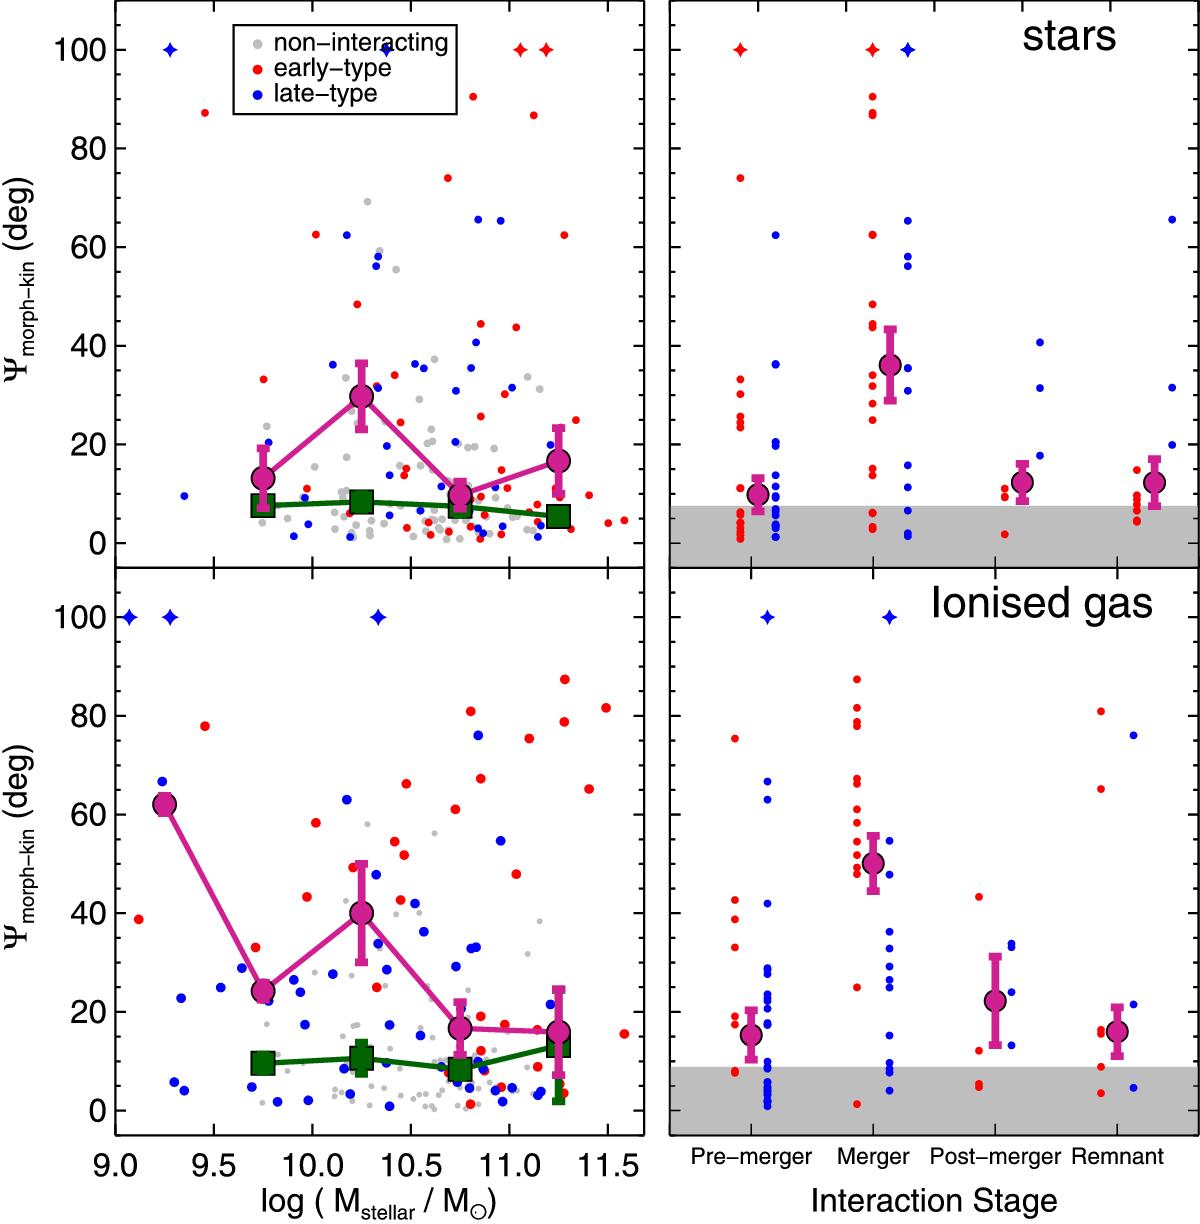
Morpho-kinematic misalignment (Ψmorph−kin) for the stellar (top) and ionized gas (bottom) components against the stellar mass (left) and the interacting stage (right). In each of the panels, the red symbols represent early-type galaxies (i.e., E, S0, and Sa) and late-type are shown by blue symbols (i.e., Sb, Sc, Sd). Star symbols represent those objects where it was not possible to determine Ψmorph−kin. For the left panels, gray dots represent the control sample, and green squares and pink circles represent the median of Ψmorph−kin in mass bins of 0.5 in units of log (Mstellar/M⊙) for the control and interacting samples, respectively. For the right panels, the pink circles represent the median of Ψmorph−kin in each interaction stage bin. Gray regions show the median morpho-kinematic misalignment obtained from the control sample. The bar in each bin represents the error determined by bootstrapping method.
Current usage metrics show cumulative count of Article Views (full-text article views including HTML views, PDF and ePub downloads, according to the available data) and Abstracts Views on Vision4Press platform.
Data correspond to usage on the plateform after 2015. The current usage metrics is available 48-96 hours after online publication and is updated daily on week days.
Initial download of the metrics may take a while.