Fig. 3
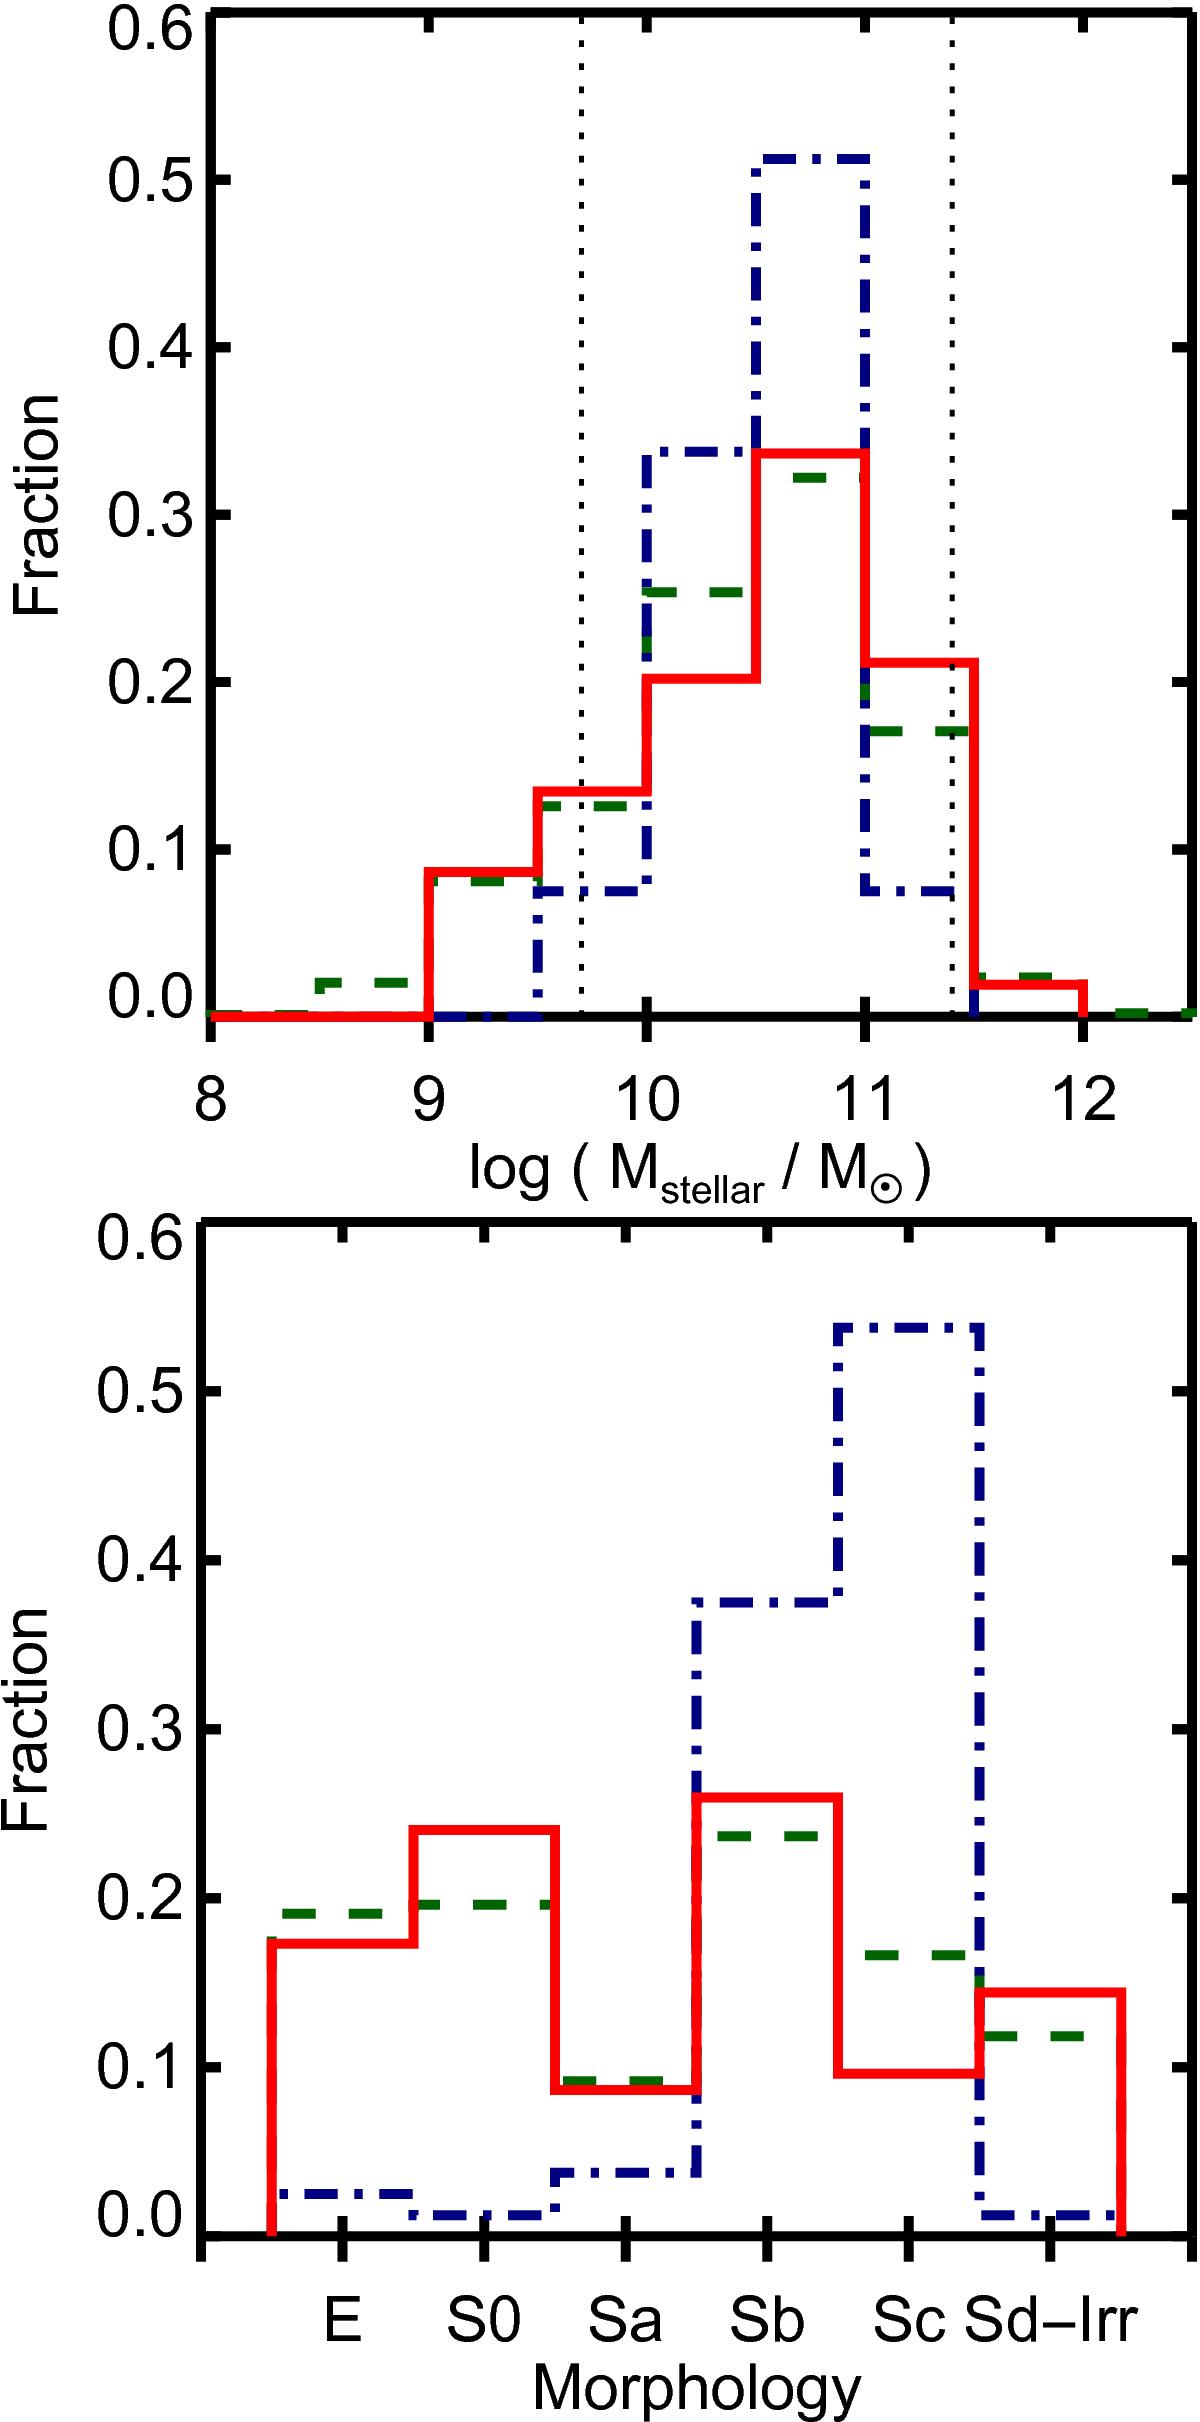
Comparison between CALIFA MS (green dashed lines), control sample (blue dash-dotted lines), and interacting sample (red solid lines). Top: stellar mass distributions for these samples. Stellar masses for each galaxy is taken from Walcher et al. (2014). Vertical lines represent the stellar mass range where CALIFA MS is considered to be representative of the nearby galaxy population. Bottom: morphological distributions of these three samples.
Current usage metrics show cumulative count of Article Views (full-text article views including HTML views, PDF and ePub downloads, according to the available data) and Abstracts Views on Vision4Press platform.
Data correspond to usage on the plateform after 2015. The current usage metrics is available 48-96 hours after online publication and is updated daily on week days.
Initial download of the metrics may take a while.