Fig. 2
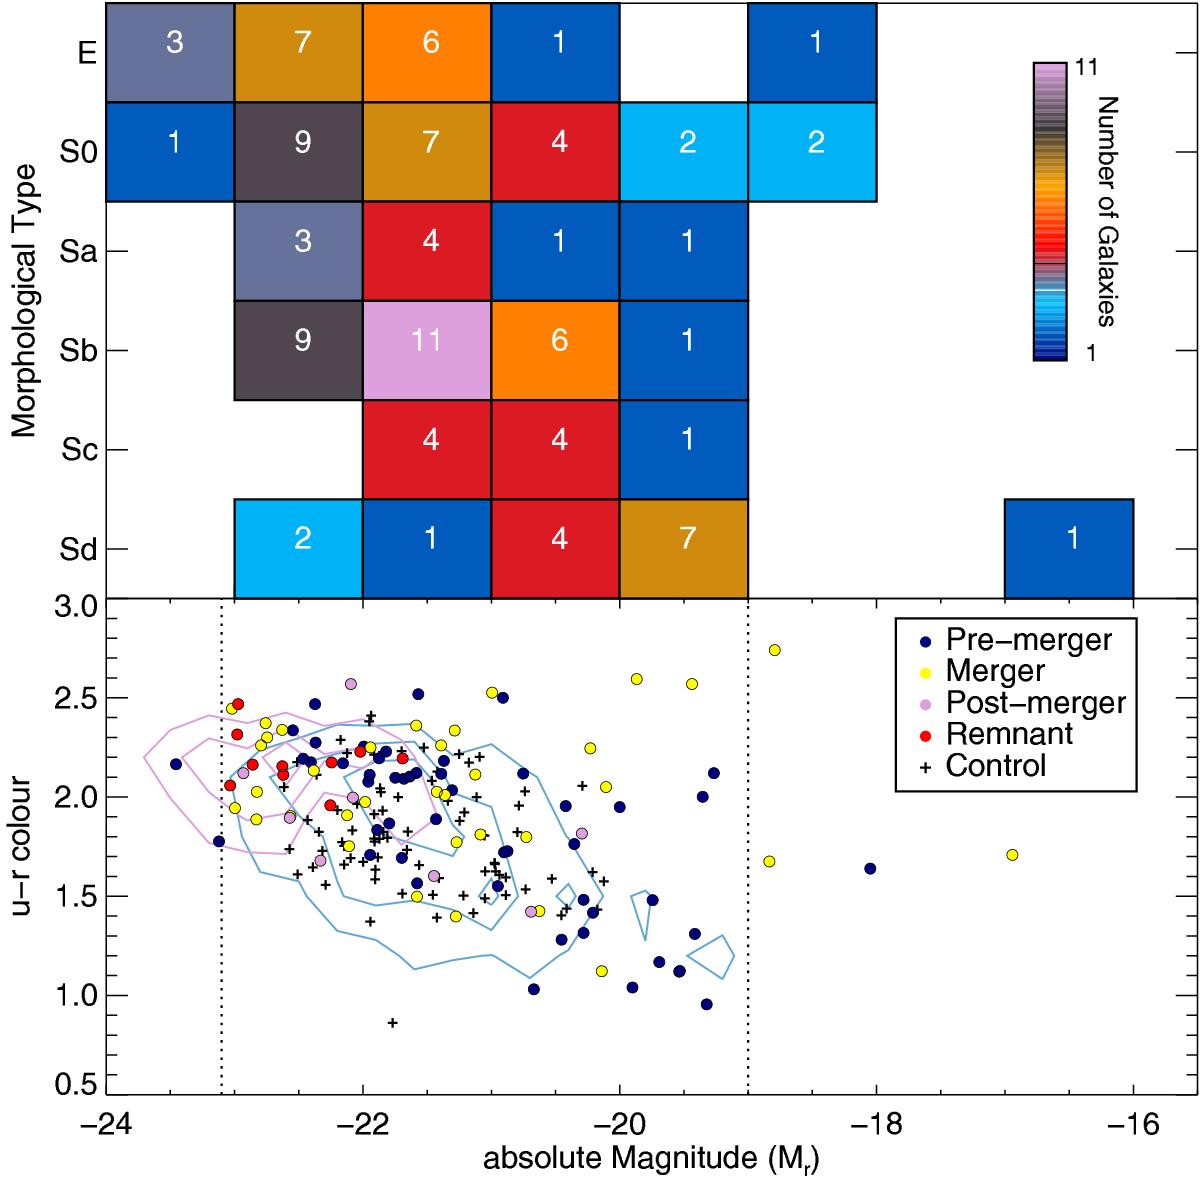
Top: morphological type distribution against SDSS r-band absolute magnitude distribution of the interacting sample. The number in each bin represents the sources included in it. Bottom: color magnitude diagram for the CALIFA MS, control and interacting samples. Morphologies and absolute magnitudes are taken from Walcher et al. (2014). Blue, yellow, pink, and red represent pre-merger, merger, post-merger, and merger remnants stages, respectively. Plus symbols represent the control sample. For comparison we plot the density contours of the CALIFA MS. Red and blue contours represent the early- and late-type galaxies. Each of the contours represents 25%, 50%, and 75% of the mother sample. Dotted vertical lines represent the range in absolute magnitudes where the CALIFA MS is representative of the overall galaxy population (Walcher et al. 2014).
Current usage metrics show cumulative count of Article Views (full-text article views including HTML views, PDF and ePub downloads, according to the available data) and Abstracts Views on Vision4Press platform.
Data correspond to usage on the plateform after 2015. The current usage metrics is available 48-96 hours after online publication and is updated daily on week days.
Initial download of the metrics may take a while.