Fig. 11
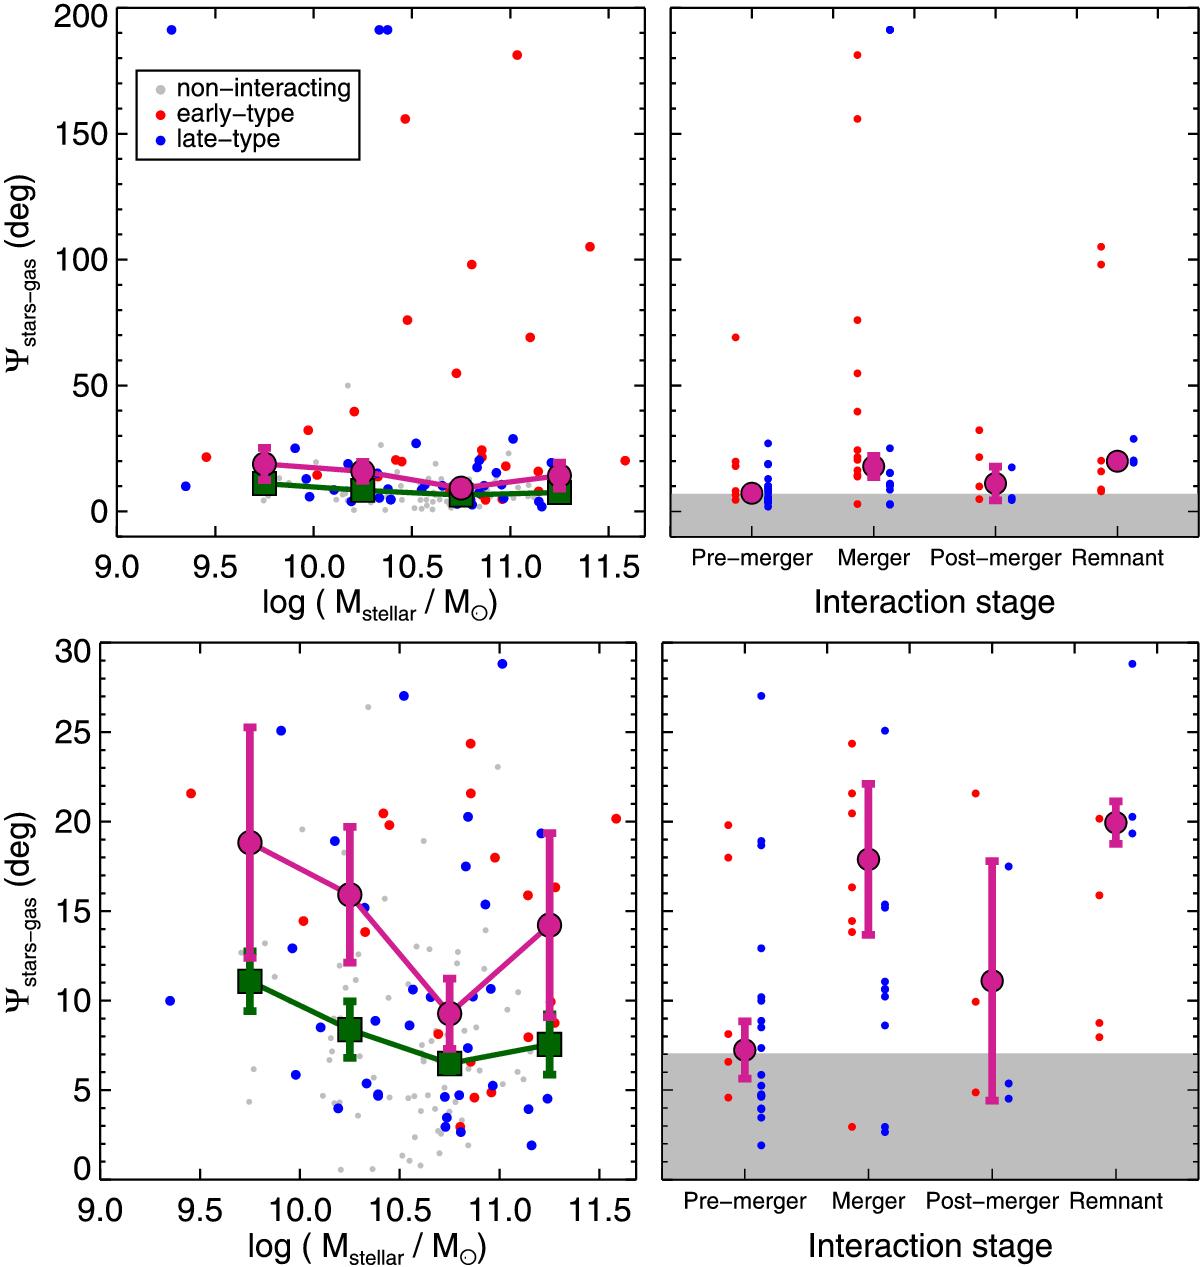
Kinematic misalignment between the stellar and the ionized gas component (Ψstars−gas) against the stellar mass (left) and the interacting stage (right). Top panels show the entire range of Ψstars−gas while bottom panels show a zoom to highlight median values. In all the panels the red symbols represent early-type galaxies (i.e., E, S0 and Sa) and late-type are shown by blue symbols (i.e., Sb, Sc, Sd). For the left panels, gray dots represent the control sample while green squares and pink circles represent the median in each stellar mass bin for the control and interacting samples, respectively. For the right panels, the pink circles represent the median of Ψstars−gas in each interaction stage bin while the gray regions shows the median Ψstars−gas obtained from the control sample. As in previous figures, the bar in each bin represents the error in determined by a bootstrapping method.
Current usage metrics show cumulative count of Article Views (full-text article views including HTML views, PDF and ePub downloads, according to the available data) and Abstracts Views on Vision4Press platform.
Data correspond to usage on the plateform after 2015. The current usage metrics is available 48-96 hours after online publication and is updated daily on week days.
Initial download of the metrics may take a while.