Fig. 10
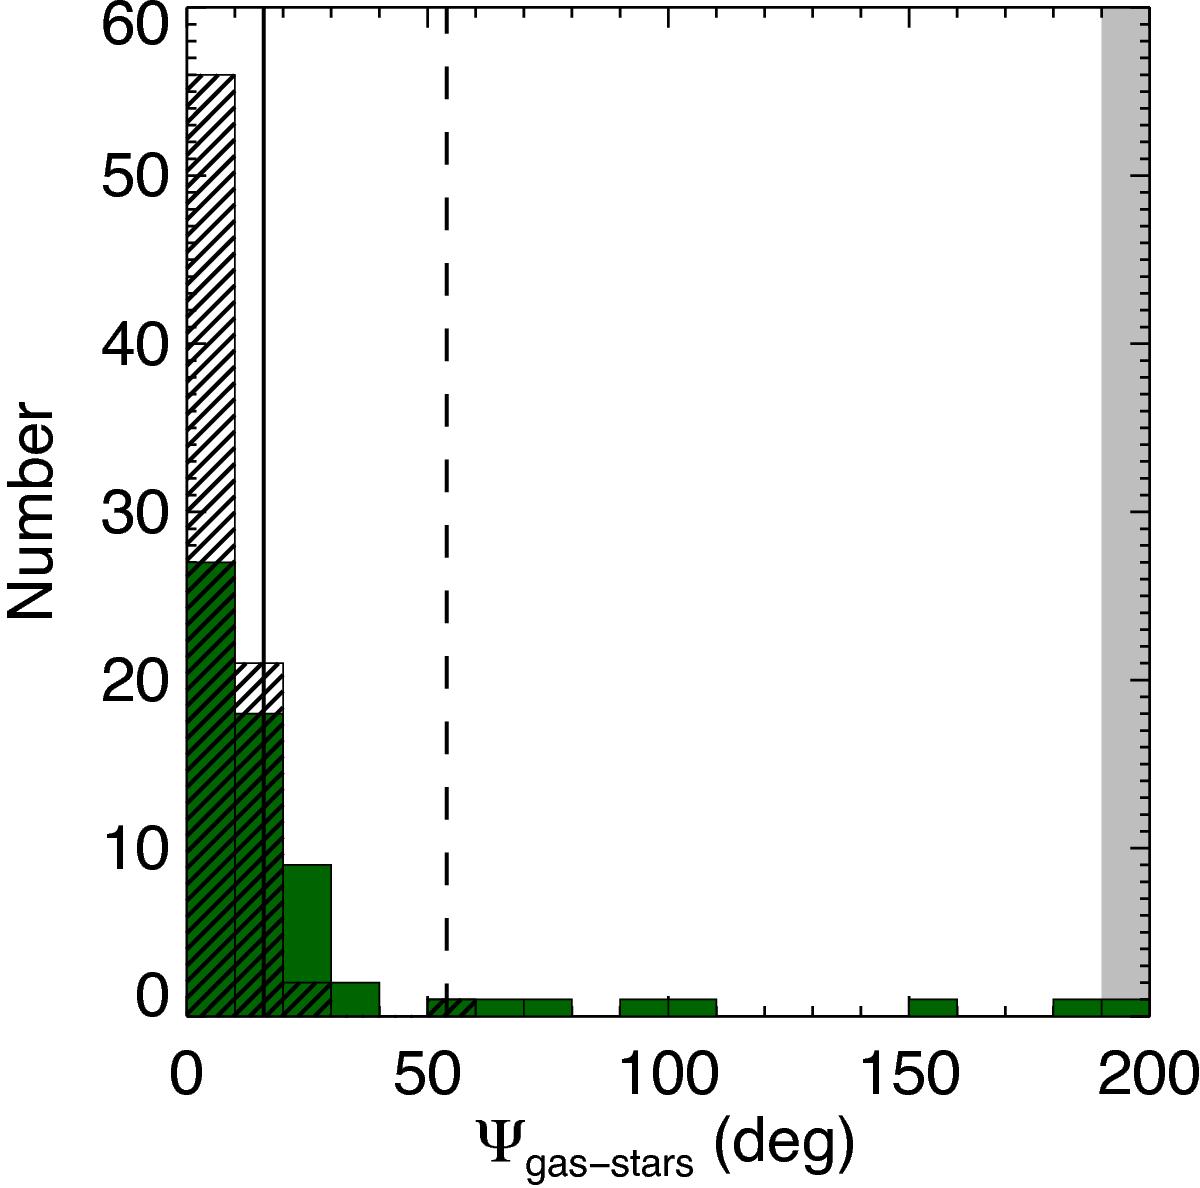
Distribution of the kinematic misalignment between the stellar and ionized gas components (ΨPAgas−stars). Line-filled histograms represent the distribution of ΨPAgas−stars for the control sample while green histograms show the distribution of these misalignments for the interacting sample. The solid line represents the largest deviation which includes 90% measured in the control sample. The dashed line represents the same value for the interacting galaxies.
Current usage metrics show cumulative count of Article Views (full-text article views including HTML views, PDF and ePub downloads, according to the available data) and Abstracts Views on Vision4Press platform.
Data correspond to usage on the plateform after 2015. The current usage metrics is available 48-96 hours after online publication and is updated daily on week days.
Initial download of the metrics may take a while.