Fig. 8
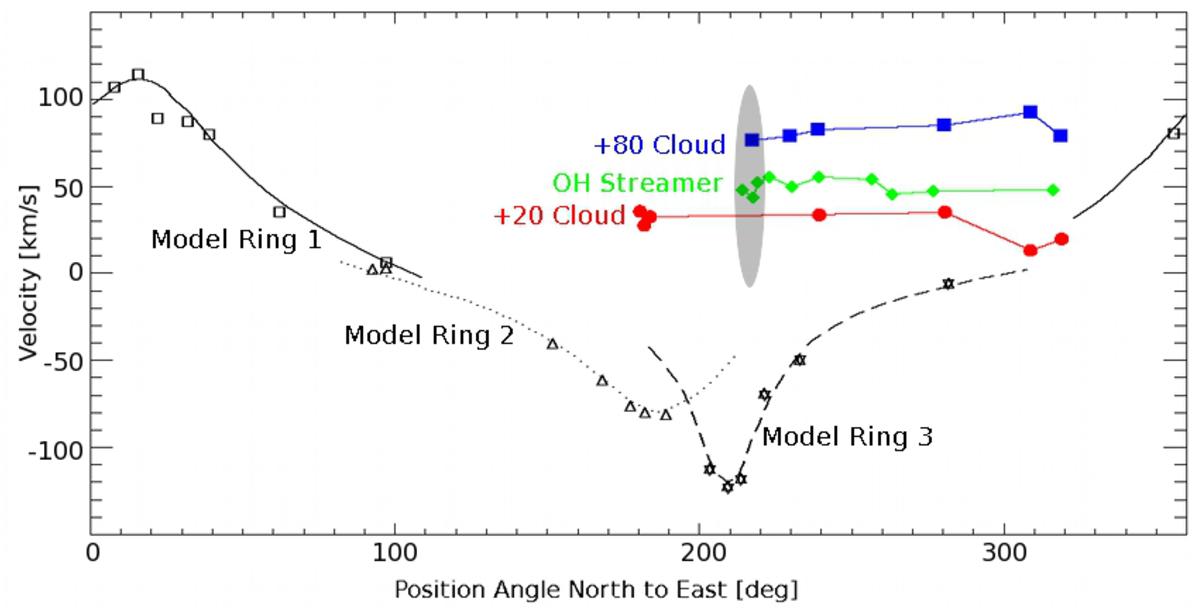
Nominal velocities as a function of position angle E of N, as measured from the position of Sgr A∗, of the OH-streamer (green filled diamonds), the +80 km s-1 cloud (blue filled squares), and the +20 km s-1 cloud (red filled circles) overlaid on a diagram by Martín et al. (2012), which shows the location of selected objects observed in CN emission. The ellipse indicates the region where interaction between the +20, +80 km s-1 clouds and the OH-streamer is suggested. The overlaid sinusoidal-like lines represent rotating ring models fitted to the core velocities in the southwest lobe (dashed line), southern extension (dotted line), and northeast lobe of the CND (solid line).
Current usage metrics show cumulative count of Article Views (full-text article views including HTML views, PDF and ePub downloads, according to the available data) and Abstracts Views on Vision4Press platform.
Data correspond to usage on the plateform after 2015. The current usage metrics is available 48-96 hours after online publication and is updated daily on week days.
Initial download of the metrics may take a while.