Fig. 6
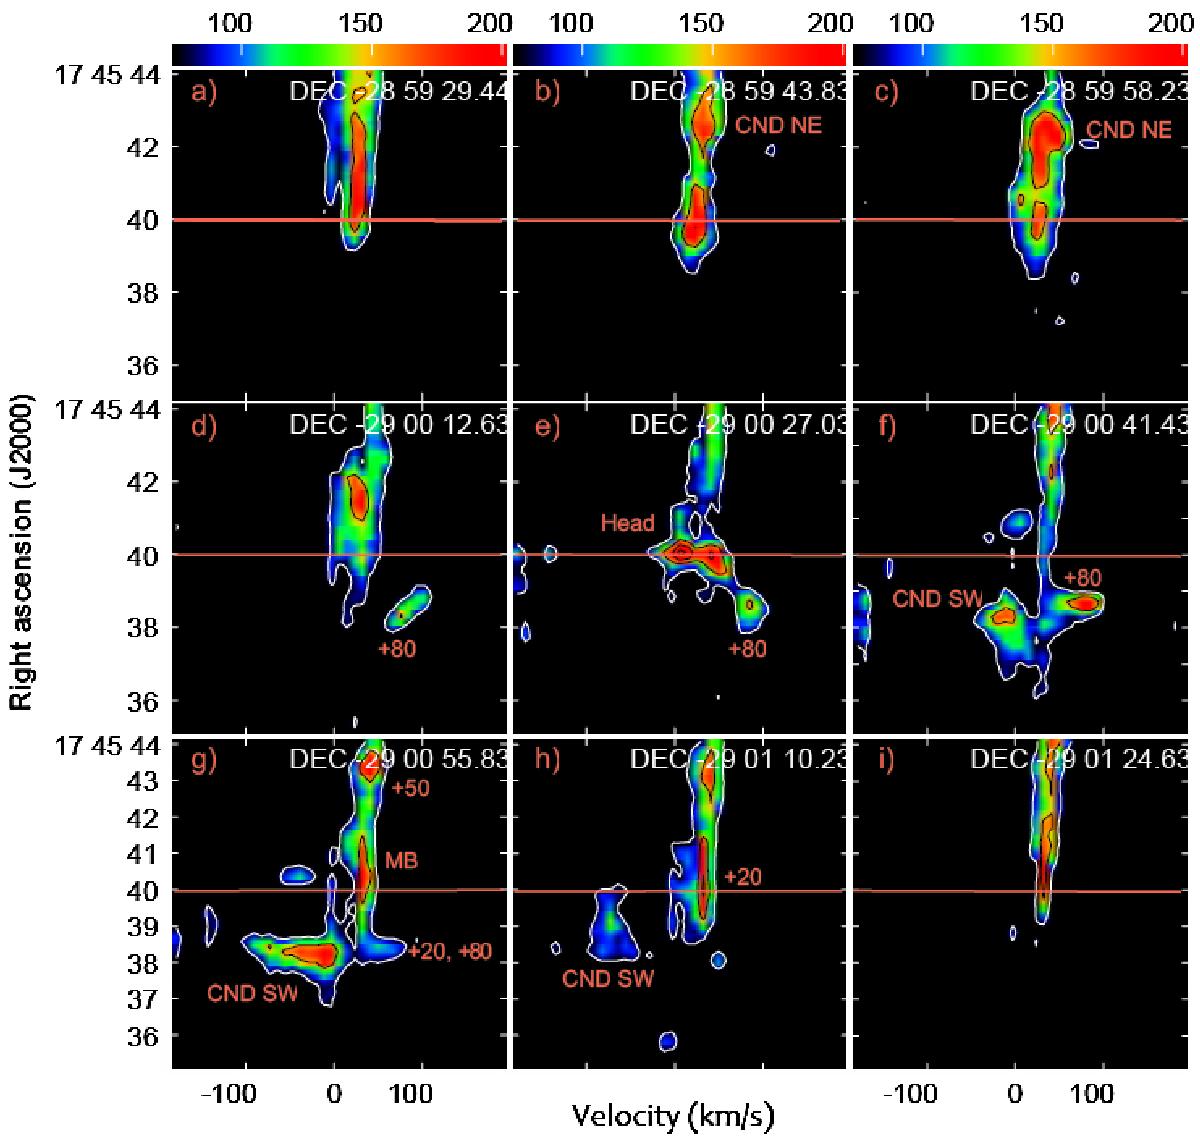
Position-velocity diagrams (RA, Vel) of OH absorption at 1667 MHz of an ~2 region around Sgr A∗. The lowest contour level is 75 mJy/beam (~3σ) and the contour spacing is also ~3σ. The horizontal line indicates the right ascension of Sgr A∗, and panel e) is drawn at the declination of Sgr A∗. (“MB” stands for molecular belt.)
Current usage metrics show cumulative count of Article Views (full-text article views including HTML views, PDF and ePub downloads, according to the available data) and Abstracts Views on Vision4Press platform.
Data correspond to usage on the plateform after 2015. The current usage metrics is available 48-96 hours after online publication and is updated daily on week days.
Initial download of the metrics may take a while.