Fig. F.1
H![]() O (black line), H
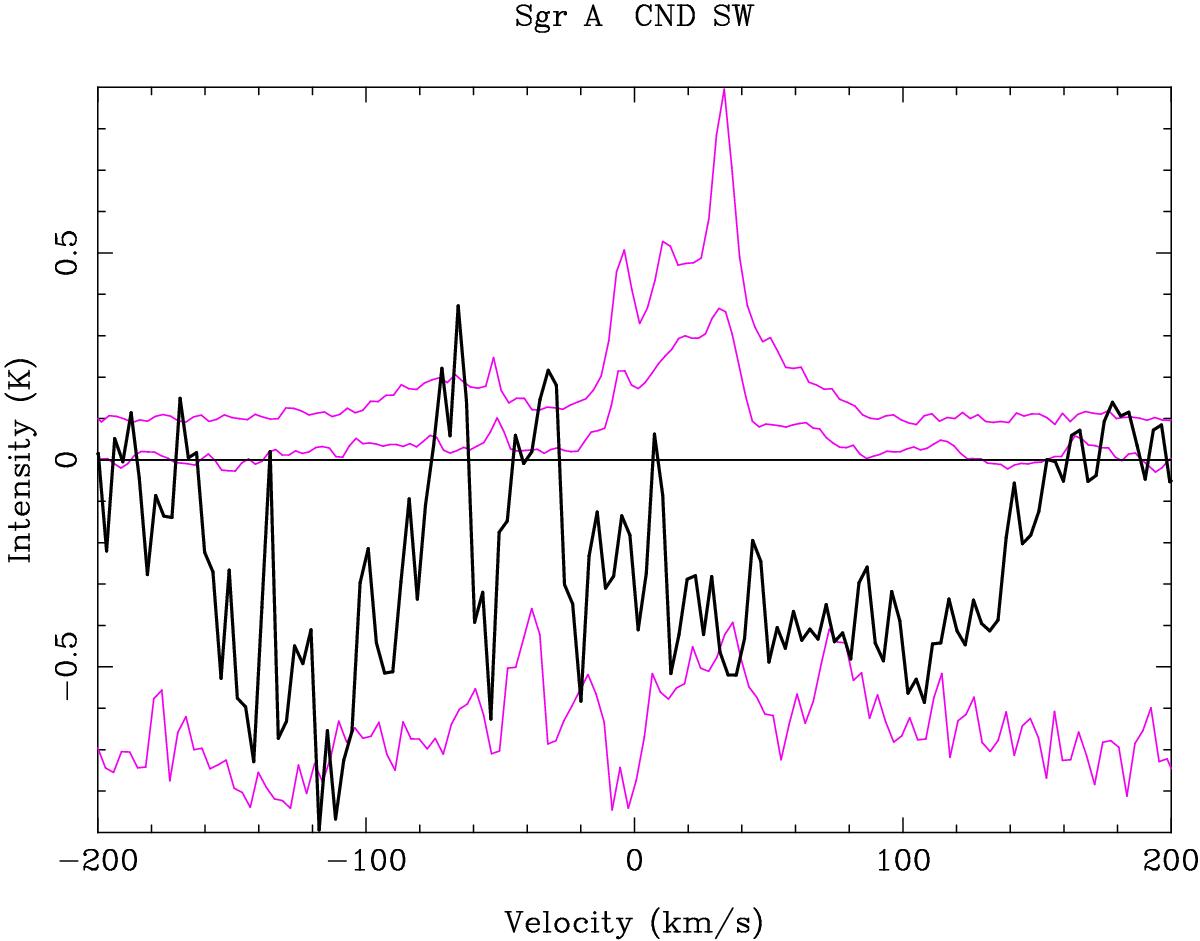
O (black line), H![]() O (lower magenta line), C18O J = 1−0 (middle magenta line), and C18O J = 2−1 (upper magenta line) profiles towards the SW position in the CND, coinciding with the position of interaction between the OH Streamer, the +80 km s-1 cloud and the SS/+20 km s-1 cloud. The H
O (lower magenta line), C18O J = 1−0 (middle magenta line), and C18O J = 2−1 (upper magenta line) profiles towards the SW position in the CND, coinciding with the position of interaction between the OH Streamer, the +80 km s-1 cloud and the SS/+20 km s-1 cloud. The H![]() O antenna temperature scale has been multiplied by a factor of 10. The H
O antenna temperature scale has been multiplied by a factor of 10. The H![]() O antenna temperature scale has been lowered by 0.7 K for clarity. The intensity scales of the two C18O profiles are in units of brightness temperature, the J = 2−1 profile having been raised by 0.1 K for clarity. The channel resolution is 3 km s-1 for all the profiles.
O antenna temperature scale has been lowered by 0.7 K for clarity. The intensity scales of the two C18O profiles are in units of brightness temperature, the J = 2−1 profile having been raised by 0.1 K for clarity. The channel resolution is 3 km s-1 for all the profiles.
Current usage metrics show cumulative count of Article Views (full-text article views including HTML views, PDF and ePub downloads, according to the available data) and Abstracts Views on Vision4Press platform.
Data correspond to usage on the plateform after 2015. The current usage metrics is available 48-96 hours after online publication and is updated daily on week days.
Initial download of the metrics may take a while.