Fig. 1
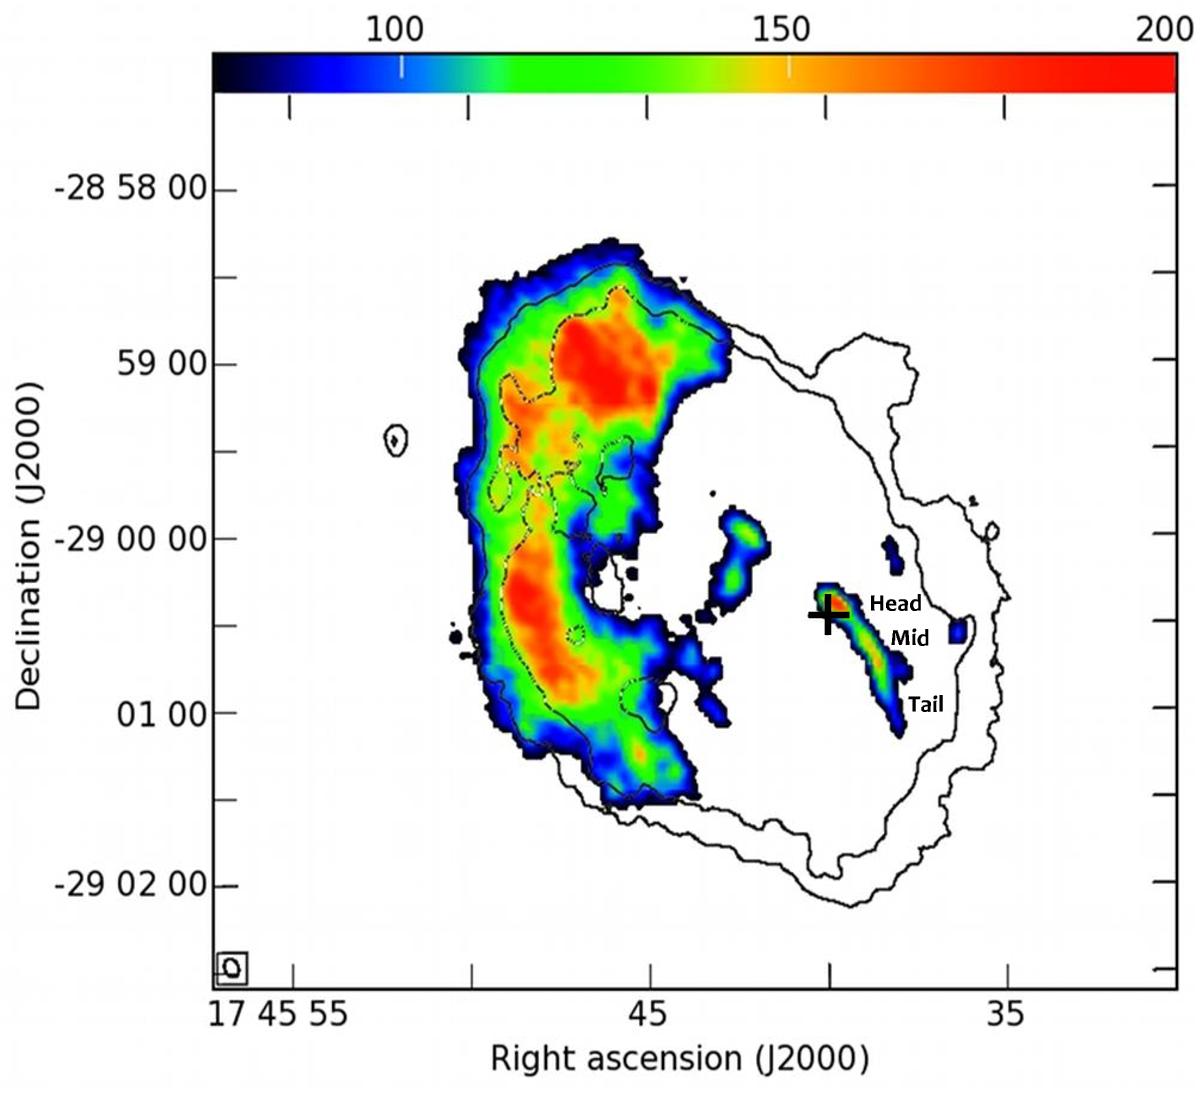
OH absorption, continuum minus line flux, at 1667 MHz shown in colour shades at a velocity of 59 km s-1. The contour lines depict the 18 cm continuum emission of the Sgr A complex at intensities of 100 and 150 mJy/beam. Sgr A∗ is indicated with a plus sign. The OH-streamer is seen running in a northeasterly direction and ends slightly northwest of the position of Sgr A*, and its parts are labelled in the figure. The +50 km s-1 cloud is seen east of Sgr A∗.
Current usage metrics show cumulative count of Article Views (full-text article views including HTML views, PDF and ePub downloads, according to the available data) and Abstracts Views on Vision4Press platform.
Data correspond to usage on the plateform after 2015. The current usage metrics is available 48-96 hours after online publication and is updated daily on week days.
Initial download of the metrics may take a while.